Explainer Video of all the Settings of Hiddentrades - Hidden Liquidity Finder
It's quite a long one (44 minutes), but wanted to touch on everything important!
If you have any questions or suggestions let me know!
Giving away 3 Beta access:
just Like, RT and Comment!
Overview with timestamps:
Core Detection & Filtering
[00:30] History:
Controls how many past candles the script checks (capped at 10,000). Lowering this number significantly speeds up the script's loading time.
[01:32] BB Formation Window:
Sets how many candles into the future the script will look to see if an order block converts into a breaker block.
[02:25] Partial Mitigation:
Defines the percentage an order block can be pierced by price action before the setup is considered fully mitigated and invalidated.
[04:48] Use ICT OBs:
Enforces stricter ICT (Inner Circle Trader) rules. It requires the displacement to have three consecutive confirmation candles moving in the opposite direction.
[06:48] Allow Two Candle Impulse:
A modifier for the ICT setting that reduces the required displacement confirmation from three candles down to two.
[07:39] Only Show Multi-TFs:
Cleans up the chart by hiding single breaker blocks, displaying only the stronger multi-timeframe setups.
[08:13] Early BB Detection:
Allows breaker blocks to confirm and form directly on the next candle after the displacement, helping you spot setups earlier.
Order Block & Gap Configuration
[09:30] Strict OB Filter: Makes pivot order blocks stricter by validating the height of the specific displacement candles surrounding the block.
[11:24] Requires Same Direction Candle:
Ensures the candle immediately preceding the order block is moving in the same direction, creating a true pivot point.
[12:18] Use Wicks for Pivot Detection:
Uses the extremes of the candle wicks to calculate the pivot low/high, rather than relying strictly on the candle bodies.
[13:16] OB Candle Color Filter:
Adds a strict color requirement to the candles forming the order block to ensure it perfectly aligns with traditional definitions.
[14:08] OB Side Mode (Pivot vs. Chain):
Allows the script to follow a continuous chain of fair value gaps (FVGs) rather than strictly requiring a perfect pivot setup.
[16:13] Displacement Candle Setup:
Explains how the script handles displacement candles that open directly inside the order block (common with market gaps).
[17:17] Allow Gaps to Create a Breaker Block:
Very useful for trading stocks with pre/post-market price jumps, allowing the physical price gap itself to serve as a valid trigger.
[18:42] Body Size Filtering:
Allows you to set a minimum percentage size for order blocks, with separate inputs for lower, middle, and higher timeframes.
Time Frame (TF) Selection Modes
[20:07] Auto Mode:
Automatically searches up to 20 timeframes above and 20 timeframes below your current chart to find setups.
[22:10] Auto From Selected:
Uses the auto-search logic, but strictly limits the search to the specific timeframes you have manually checked off.
[23:49] Selected Only:
Scans exactly the timeframes you select, regardless of the timeframe you are currently viewing on the chart.
Visual & Chart Display Settings
[25:04] Merge Nearby Breaker Blocks into Clusters:
Combines multiple overlapping or nearby zones into one clean, unified cluster zone.
[27:27] Show Order Blocks Inside Cluster:
Hides isolated single order blocks, only visualizing those that contribute to a larger multi-timeframe cluster.
[29:03] Distance Filter:
Instantly hides any setups that fall outside a set percentage range (e.g., 10%) from the current market price.
[30:01] Show Forming Breaker Blocks:
Displays upcoming setups in a faint gray color before the final confirming candle has officially closed.
[31:52] Hide Mitigated BB Always:
Automatically removes breaker blocks from your screen the moment price action fully mitigates them.
[34:10] Show Recently Deleted Breaker Blocks:
Keeps failed or mitigated blocks visible in gray for the last 240 candles — an excellent feature for backtesting.
[36:03] Text Offsets:
Adjusts the padding of the text labels so they sit cleanly away from the chart blocks without overlapping.
[37:39] Merge Overlapping Labels:
Intelligently combines the text labels of two nearby breaker blocks into a single centered tag to prevent visual clutter.
[39:23] Colors and Opacity:
Customizes block colors and automatically fades the opacity of lower-timeframe blocks while keeping higher-timeframe blocks solid and prominent.
[41:32] Bold Text Label:
A simple toggle to bold the chart labels for easier reading.
⭕️FULL EDUCATIONAL ARCHIVE⭕️
This is the complete "archive" of all the most important educational post I created during these years.
Hours and hours of intense work condensed into 1 single post, so you'll be able to study this free material that I think will truly take you to the next level.
1. Liquidity related technical concepts:
https://t.co/awvo0Jij2Z
2. Way of charting from scratch:
https://t.co/rZjUQkHmyq
3. The importance of candle closures:
https://t.co/55nKllggiA
4. The importance of candle closures pt.2:
https://t.co/AuVRC2SZR1
5. The truth behind supply & demand levels:
https://t.co/4IvnCjXu8c
6. Fibonacci reverse sequence:
https://t.co/rc3V0SVWNx
7. Fibonacci extensions in play:
https://t.co/VV9SKGY4Rt
8. Setting targets based on data:
https://t.co/Qdv2qRXoSo
9. The truth behind fundamentals: (in crypto)
https://t.co/MHXq4E8b0r
10. How influencers scam you:
https://t.co/fKPvjg5MDY
11. How influencers scam you pt.2:
https://t.co/bxg1Oqj3TP
12. Reprogramming your mind for taking profits:
https://t.co/KPQYryk9uO
13. Order blocks guide:
https://t.co/UG2DW1CCb7
14. HTF distribution in play (no fundamentals):
https://t.co/imXMYSG81Q
15. Fair Value Gaps:
https://t.co/xByxZYQgLS
16. Distribution at Fair Value Gap:
https://t.co/64rUPPvkB9
17. Fibonacci insights:
https://t.co/D5DO1qiosi
18. Fibonacci settings:
https://t.co/74piO8akuX
19. Compound game:
https://t.co/aHc0xSl6fJ
20. Taking profits & strategies:
https://t.co/gQ4lL2oCNI
21. The game of inefficiency, liquidity and orders:
https://t.co/UjA2o3Wqyb
22. Backtesting a strategy:
https://t.co/jTZhPFsQ8t
23. The quintessential mental model of a real trader:
https://t.co/l95ZyGdT4E
24. Using volume areas to form a bias + repricing and migration of value + using defensive levels to place the stop + execution of a MTF long inside an HTF range:
https://t.co/Cqsl1AV5c7
25. Value migration theory + understanding market's behavior and placing trades + protection levels:
https://t.co/QplrrYYJIa
26. AMT full framework:
https://t.co/D9GLAYjotw
27. Understanding capital rotation:
https://t.co/vdVBGJRNFA
28. Intermarket analysis:
https://t.co/6V9m7XxvBK
29. Intermarket cheat sheet:
https://t.co/8i7troUv8O
30. How to form a bias with intermarket analysis + spotting opportunties + capital rotation + alpha & beta plays:
https://t.co/H3XYoyfufC
31. Continuation of the post above:
https://t.co/9SOKmXpV2f
32. Qualifying ranges + VP:
https://t.co/UiBAtEtG03
33. Scalp on NYO to understand liquidity dynamics:
https://t.co/p64f25cV1K
34. Scalp on NYO & explanation:
https://t.co/NN5nij99Ye
35. 9-steps psychological framework to not sabotage yourself:
https://t.co/al5I7prhLw
36. VSA analysis HTF example:
https://t.co/RPIXwszGcy
37. VSA pt. 2:
https://t.co/5Bv0ERtGk8
38. Qualifying supply & demand based on MA:
https://t.co/ssdBnWaXPZ
39. Orders absorption at levels:
https://t.co/l7FHMQNVxQ
40. The importance of trading less assets + TAO example:
https://t.co/uNGBSK11fc
41. Mini price action + volume live mastercalss:
https://t.co/ZLTA9UPAqI
42. Isolating price action with FRVP:
https://t.co/n7gG5YevV2
43. Price discovery methodology:
https://t.co/InsBQs705v
44. Failed Auction:
https://t.co/mXBBiCGzJ1
45. How to survive to an economic downturn:
https://t.co/5jBLYXnjyX
For everyone who wants to improve his game:
The moment I started to abandon the classic trading knowledge regurgitated left and right, is also the moment I started to figure out how market dynamics work and actually how to profit from them.
Every time I look back at how I was charting 3/4 years ago in fact, a shiver runs down my spine.
And It's no wonder that many label trading as a scam.
90% of the concepts presented are full of holes, giving people advice to find that magical indicator or setup that will allow them to become a professional and profitable trader in "4 simple steps."
Harsh truth: it doesn’t exist.
Stop beating yourself up trying to find the easy way, because this will only send your capital into a never-ending downward spiral.
And at the end of this "cycle," you'll blame trading, the "gurus," or bad luck, without taking responsibility for your own choices.
If you know of even one easy path in life that has led to something good, let me know, but I'm sure you won't find a single one.
What personally opened my mind was studying smart money concepts.
I wrote plenty of posts related to these theories and I leave them here so you can study them, if you want to grasp what actually works:
- Way of charting : https://t.co/rZjUQkGOIS
- Liquidity concept 1:
https://t.co/AIibrw2QM0
- Liquidity concept 2:
https://t.co/smBgxZG9Vt
- Liquidity concept 3:
https://t.co/yRZC7oYMHb
What's important to highlight in the study of SMC however, are 2 things:
1. Spending hours trying to understand why and how a move occurs is useless if you don't create a strategy and make a severe backtest before.
Individuating the bias? Yes.
Individuating the zone? Yes.
Individuating the correct setup? Also yes.
But the most important step is always to be able to spot the trigger , that particular condition that makes you enter or exit a trade.
Otherwise, all the time you spend on figuring out the mechanisms is wasted time.
2. Contextualization and personal style.
My foundation or base, whatever you want to call it, relies on SMC, that's true but..
I found my style over time, which is made through the use of these concepts + extra data related to market conditions like:
- OI
- Funding rate
- CVD
- Spot/Perp volumes etc
This is what helps me in making an analysis that gives me a statistical edge.
So don't use SMCs alone, try to adapt them to your style by individuating your TF, risk tolerance and other factors that make you pull the trigger.
There's no holy grail and everything is based on probabilities, but if you start from what I wrote in the quoted posts, you'll already be ahead of 90% of participants in this space.
Trust me.
TL is talking about “BTC’s funding rate being negative for xyz days in a row”. What does that truly mean?
Funding Rate + Open Interest (OI) together form one of the strongest positioning signals in derivatives markets. Reading them jointly tells you whether price moves are driven by new positions, liquidations, or spot demand.
My basic understanding :
- Funding Rate : periodic payment between longs & shorts (sentiment + leverage bias).
- Open Interest (OI) : total outstanding contracts (capital entering/leaving derivatives).
High-Probability Signal Combos
🟢 Bullish Signals
- Price ↑ + OI ↑ + Funding flat/negative
→ Smart money longs entering quietly
→ Often precedes strong continuation
- Price flat + OI ↑ + Funding negative
→ Shorts piling in at support
→ Classic squeeze setup
🔴 Bearish Signals
- Price ↑ + OI ↑ + Funding very positive
→ Late long FOMO
→ Liquidity above gets targeted
- Price ↓ + OI ↑ + Funding negative
→ Shorts chasing breakdown
→ Move can extend but squeeze risk rises
Whales prefer:
Rising OI + neutral/negative funding while price ranges.
Why?
Because that means retail is fighting the move and providing liquidity.
Think of OI as fuel and funding as direction.
- High OI = lots of stops/liquidations stacked
- Extreme funding = crowded side
Crowded side = future exit liquidity.
To get advanced read we can also track OI delta vs price delta:
- Price ↑ faster than OI ↑
→ Spot demand leading
- OI ↑ faster than price ↑
→ Leveraged speculation leading
Spot > leverage = sustainable trend.
✅ Simple Rule
OI tells you how much fuel exists.
Funding tells you which side holds the fuel.
Basic Cheatsheet :
1. Positive funding + rising OI → new longs are entering aggressively, signaling FOMO and increasing risk of a pullback.
2. Positive funding + falling OI → longs are closing positions, indicating profit-taking and a healthier trend.
3. Negative funding + rising OI → new shorts are piling in, showing fear and creating potential squeeze fuel.
4. Negative funding + falling OI → shorts are closing, signaling relief and increasing odds of bullish continuation.
In trading, most people would do way better by just chilling and waiting for those solid key levels to get hit, then scooping up assets on the spot market instead of jumping into high-risk high-leverage longs.
The real game-changer anyone can achieve success with: using dollar-cost averaging at smart, strategic points.
Over time, it can seriously build your wealth. You don't need to nail every single level with pinpoint accuracy. You can let some of that go and focus on the bigger picture.
A lot of times, just buying spot when price touches a monthly BB is a smarter move than trying to long the 10% range, especially if you're not great at ultra-refining it alongside finding confluence with majors, and understanding whales psyops.
Bottom line: play it smart, check your ego at the door, and you'll have a real shot at coming out ahead in this wild, rigged game.
My 4 Fibonacci settings: (fast recap)
👁️Complete (the setting I use the most):
1
0.236
0.382
0.5
0.618
0.705
0.786
0
1.272
1.454
1.618
👁️ Negative (the setting I use in confluence with the 1.272/1.454/1.618):
- 0.5
- 0.618
- 0.705
- 0.786
The -0.5 & -0.618 are pretty much aligned with the 1.454 & 1.618 -> extra confluence together.
👁️ OTE (Optimal trading entry, used with confluence coming from OBs/HOBs):
0
1
- 1
- 0.62
- 0.27
0.62
0.705
0.79
👁️ Percentages (the one I use for optimal retracement levels)
100%
88.60%
78.60%
70.50%
61.80%
50.00%
38.20%
23.60%
0%
Save each setting on your TV with these different names so you'll be able to quickly switch from one to another when you're charting.
Almost everything you need.
If you trade like retail, you provide liquidity.
If you understand liquidity, you stop being retail.
🎥 Episode 2 is live.
The basics about Retail vs Smart Money
https://t.co/G1QWzFkiaW
Decoding MT’s Charts 1-11#
1# Always assume price might take all the Liquidity if there are OBs nearby your BB.
https://t.co/DCPuYTJiD0
2# Wick Supply/Demand. Overlapping Supply with BB
https://t.co/p5rA9oFL17
3# Overlapping OB and OP might have higher confluence
Sequence: OB → Wick(Reversal) → FVG → OP.
https://t.co/tRq61hhIgJ
4# Stop placement usually covers the FVG. If there are lower TF OB/BBs within that FVG it might serve as an additional shield for the stop.
+MT used Trendlines
https://t.co/727HitPewo
5# Refining into lower TF Levels for more precise entries and candle close confirmation as confluence for entry.
https://t.co/RllHIarsI3
6# Refining for the level with the most overlapping confluences of OB/BB and EQ of OB/BB
https://t.co/ASFS4PeU5U
7# Cover two levels with one position using the second level for stop placement. Always monitor multiple TFs, price might reverse at a higher TF Level frontrunning your refined level.
https://t.co/c8Njy4tdix
8# Another refining example
https://t.co/hZGNM6bN6f
9# Basic trade setup. 3 step process, Stop Placement, and how to invalidate
https://t.co/HImrMrjnWX
10# Overlapping levels. You can refine into a Key Level within the FVG of another Key Level
https://t.co/STx3JWahkl
11# TPO/VP Confluence
https://t.co/OtXgDkSRdj
USDTD BTCD ETHD OTHERSD - Relationship
From a Moneytaur perspective, USDT.D doesn’t “control” the market in a simplistic cause-and-effect way. It acts more like a global risk switch that tells you whether capital is willing to participate or is stepping aside. When USDT.D rises, it means liquidity is exiting risk and moving into stables. That pressure always hits altcoins first, then ETH, while BTC tends to hold up the best because it’s treated as the reserve asset of crypto. When USDT.D falls, capital is leaving stables and re-entering risk, but that money does not flow evenly across the market.
This is where most traders misunderstand the relationship. A 5% drop in USDT.D does not mean alts “should” move 5%. Alts usually move far more, sometimes 2x, 3x, or even more, because they sit on thinner order books and are heavily leveraged. When liquidity re-enters the market, market makers don’t deploy it evenly. They target the instruments where liquidation density is highest, and that is almost always altcoins. That’s why BTC might move modestly while certain alts explode, and why during downside moves alts get disproportionately destroyed.
However, USDT.D alone is never enough. Moneytaur treats it as a necessary condition, not a trigger. The real decision-making layer comes from dominance charts, starting with BTC.D. BTC dominance tells you where incoming capital is being absorbed. If BTC.D is rising while USDT.D is falling, it means new money is entering crypto but preferring safety. In that environment, BTC rallies, ETH lags, and alts underperform or bleed. This is exactly why you often see periods where people say “USDT.D is dumping but alts are doing nothing.” The liquidity is there, but BTC is monopolizing it.
When BTC.D starts to fall, that’s when rotation becomes possible. It means BTC is no longer absorbing the majority of inflows and capital is beginning to look elsewhere. Even then, Moneytaur does not jump straight into “alt season” narratives. He watches ETH.D next. ETH dominance rising is a critical intermediary signal. ETH is the bridge between BTC and the broader alt market, and a rising ETH.D tells you that smart money is accepting more risk, but still in a relatively liquid, structurally strong asset. Without ETH.D strength, any alt rally is usually short-lived or highly selective.
Only when OTHERS.D starts to expand do you get broad-based alt moves. That’s the point where liquidity is no longer concentrated in BTC or ETH and begins dispersing into mid and lower caps. Volatility increases sharply here, which is why alt seasons feel chaotic and explosive. Until OTHERS.D confirms, most alt moves are rotations, not expansions.
The final layer, and the one most people completely ignore, is liquidity timing. Market makers do not push these dominance shifts randomly. They align them with higher-timeframe liquidity zones, hidden order blocks, and areas where positioning is extreme. This is why USDT.D, BTC.D, ETH.D, and OTHERS.D often react violently at specific levels rather than gradually drifting. Those reactions are engineered to trigger liquidations, force emotional decision-making, and redistribute inventory.
So the simplified Moneytaur framework looks like this: USDT.D tells you whether capital is available, BTC.D tells you who is absorbing it, ETH.D tells you whether risk appetite is increasing intelligently, and OTHERS.D tells you whether expansion is real. You don’t trade any of them in isolation. You read them together, align them with liquidity, and then execute on price action. That’s the difference between reacting to percentages and understanding the mechanics behind them.
✍️When the price of an asset moves into an HTF (or even MTF) supply, demand, or breaker, you need to understand the context before taking a decision.
The level itself only tells you where liquidity may sit but it does not tell you how participants are behaving around it.
This is why tools such as CVD, funding rates, and open interest become essential.
They reveal whether the move into the level is driven by genuine initiative, forced positioning, or merely a lack of liquidity.
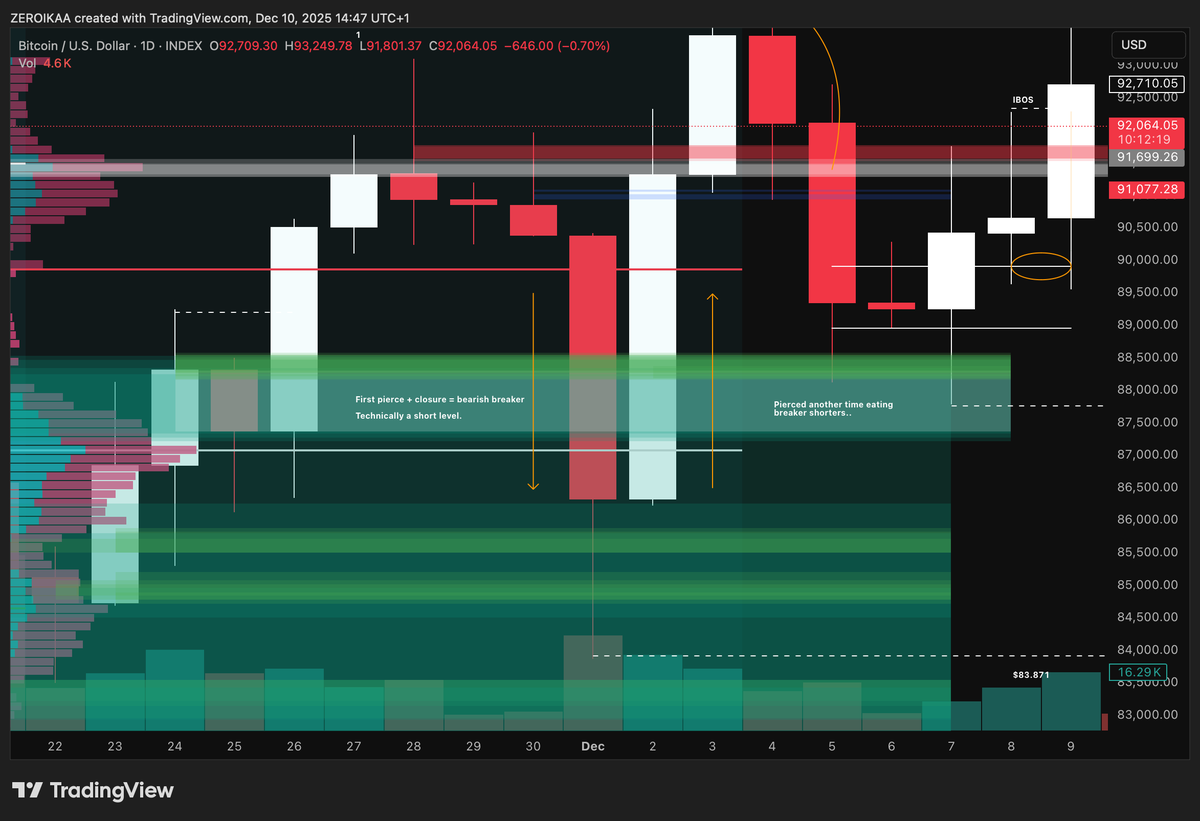
In order to explain it better, I'm gonna use a recent example.
In this BTC chart posted above, you can clearly see that the price decided to pierce for the first time a previous demand closing below and therefore confirming the breaker formation.
Technically speaking, that was a level to short, right?
I already discussed about the importance of contexualizing levels in premium/discount here https://t.co/7FrjmrJZIy but if we look deeper and we observe the broader narrative building on external metrics, they suggested why it wasn't a proper level to take.
During the prior HTF move to the downside in fact, we had a strong reset in these metrics:
- Funding shifting from highly positive to healthier conditions
- Open interesting coming down as the majority of longs were closed
- Spot CVD selling heavily, true..but at HTF demand, signaling absorption rather than continuation
- Aggregated liquidations signaling a cluster of huge longs being flushed out
Were those metrics pointing out for shorting more (the breaker on isolation) or instead favoring longs?
This is one of the reasons why S/D/BB fail from time to time, because without market context they remain pure isolated levels.
Something to note down, study and share.
“You’ll never know exactly what’s next, but you can map out the highest-probability plays and size your bets according to the odds..“
That’s the entire game.
Nobody knows the future.
Just like in poker, you bet on the most likely outcome, not on certainty.
And you only survive long-term with proper risk management.
Take pocket aces in Poker.
Pre-flop you’re statistically ahead, yet you can still get wiped out.
High probability ≠ guaranteed outcome.
This is why strict risk management is non-negotiable.
Your risk per trade = how much you lose if your stop or invalidation gets hit.
For me this is usually 0.5%–3% of the account depending on strength of the setup.
To size a trade correctly, you can use this formula:
M = (A × r × E) / (L × |E − S|)
Where:
M = margin needed
A = account size
r = risk (decimal)
E = entry
S = stop
L = leverage
|E − S| is the absolute distance, always use the positive value so this works for shorts too.
Example (ETH long, 5× leverage).
This is just an example, do not copy (!)
A = 100,000
r = 0.02
E = 2,750
S = 2,600
L = 5
Resulting Margin (M) is 7,333 USD
This means the stop / invalidation would cost you 2,000 USD (2% of the account).
If price reaches 4,000$, profit is:
Profit = (M × L) × ((Exit − E) / E)
= 16,666 USD
Risk–Reward:
16,666 / 2,000 ≈ 8.33
Note: this is the most optimistic RR, in reality you usually scale out earlier partially.
You don’t control outcomes.
You control:
- your risk
- your potential profit
- your decisions and actions
If you position based on probabilities (and if you can assess those probabilities) you should make consistent profit over a series of trades.
Note that the strength of a setup (which goes along the probability to succeed) and the RR ratio influence how much risk I take per trade.
Only strong / high probability setups get allocated 2-3%, usually I risk 0.5-1% per trade.
This is the operationalisation framework I use for what MT wrote here.
I’ve been studying the gold @Moneytaur_ left for us for the past 8 months. At first it was overwhelming, so I broke it down into portions. That simple act changed how I learn, how I think, and even who I am becoming.
These notes are from a few months back, lightly edited for sharing. Writing puts structure to thought, and thinking in public sharpens the edge.
I’m deeply grateful for what I’ve learned, and aware of how much time it takes. Maybe this helps a few of you starting out, maybe even some of those further along.
My hopes are these notes can free up some extra time.
Spend the extra time decoding his charts. They’re a literal cheat code, but only if you’re willing to put in the work and stay curious.
----------------
MTM - PRICE ACTION
- Price Action is King -
Liquidity is what moves markets. Higher timeframes hold more liquidity and paint a clearer path for us to follow. If liquidity is the destination, then Price Action is the journey.
PA leaves behind "footprints" that give us clues as to where the market will move toward. Once these destinations are reached, markets start to move toward the next most profitable or tactical stop. These footprints reveal the intentions of market makers.
Learn to read them like a native language.
Many retail traders rely on indicators, tools that lag behind price. Price Action anticipates. Price Action is King.
"It's crucial to recognize that price action is king. Before applying any indicators to the chart, you need to master the skill of reading PA and market makers/whales 'footprints'. This will benefit you in the long run, even if you ultimately decide to use an indicator-based strategy."
"PA leaves traces of what whales do and show the levels of interest where they will buy or sell again."
- Bodies vs Wicks -
Bodies
We rely on candle bodies because they hold the majority of liquidity. Unlike wicks, candle bodies are concentrations of price action and volume. The higher the timeframe, the more powerful the body becomes.
HTF bodies are where institutional trading volume is located. These are the areas that smart money target. Since we want to win this game, we align ourselves with the whales who dictate the moves.
Often, a high timeframe body consists of many lower timeframe bodies. Refining these levels can offer us precise entries and exits, helping maximize R:R for the trades we take. Refined levels are also powerful because the lower we can refine a hidden level, the less mitigation has happened. Reduced mitigation = more remaining liquidity.
- Bodies = Liquidity
- HTF Bodies = Institutional liquidity
Wicks
Wicks, on the other hand, can easily be manipulated. A wick can be formed in a split second and show up on a 6-month candle. Some wicks hold next to no liquidity, and offer little incentive for price to revisit.
Some wicks do hold liquidity, the way to know is to move to lower timeframes and check. If the wick holds real liquidity, the likelihood of price revisiting it increases, especially if it coincides with HTF key levels.
"I only use "wicks" if they represent untapped bodies on lower TFs."
The size of wicks is irrelevant. Only whether they hold liquidity matters.
🔺Important: Flash wicks and large wicks on lower timeframes are best avoided when drawing fibs.
"Don’t Use Wicks for Entries/Stops: Set stops based on bodies, not wicks, to avoid being caught in SL hunting. 'Flash-wicks are useless, both for fibs and to consider entries/SLs.'"
"Trading based on wicks will increase your likelihood of being stopped out and increase your risk dramatically."
- Wicks & Manipulation -
Wicks often reveal the hidden hand of market makers. They’re not random, they’re a tool used to manipulate liquidity and herd behaviour.
"Flash Wicks" are engineered moves designed to grab liquidity sitting above or below supply and demand. These sudden moves trigger stop-losses, liquidate traders, and induce participants into emotional reactions.
This is commonly referred to as stop loss hunting or a liquidity grab.
Flash Moves & Engineered Liquidity
Market makers carefully engineer the environment before striking. It usually unfolds in three stages:
1. Priming:
- Price Action is shaped to trap retail into predictable positions.
- When exact dates are known, and general sentiment is bullish or bearish, liquidity will often be engineered to confirm that bias, priming participants to overcommit.
2. Triggering:
- A news event or headline is released at the perfect moment into key levels.
- PA usually crescendos up to a known date, reinforcing the herd’s bias.
3. Executing:
- Break of a key level to trigger breakout traders and Fear/FOMO.
- Followed by a sharp reversal, trapping late entries.
"Flash moves will happen when data is released. Before that it will be engineering liquidity."
🔺 Market makers do not trade the news. They make the news and trade predictable reactions.
🔺The lower the trading volume, the easier it is to manipulate. Flash wicks will be more exaggerated, and emotional reactions even stronger. Be especially cautious when trading micro caps.
"Often these coins on lower volume will wick into MTF/HTF liquidity, stopping/liquidating newbie traders, finally reverse, and they will enter 'revenge trading' mode."
"Wicks can indeed be many times 'SL hunting', thus holding no liquidity on them on LTFs as there wasn't any PA going on there (many times), thus price not having any reason to go for such wicks. It can go for it if there's 'hidden' liquidity on an HTF wick (on LTFs), and this is something most retail cannot see or understand."
- Confirmations & Signs -
Reading Wicks
Wicks can reveal market makers' intent, but only when read in relation to Market Structure (MS), Premium & Discount (P&D), Supply & Demand (S&D), and general sentiment.
Combining this with an understanding of how PA is weaponized to create buyers and sellers at tops and bottoms, you gain another powerful form of confluence.
Key Signals:
- Long wicks into HTF levels without a body close above/below: Sign of reversal, "fuel" was taken.
- Long wicks stabbing through random levels without HTF relevant body closes: Likely pure stop loss hunting, especially if it happens quickly.
Wicks are often used in combination with well-known retail patterns like Head & Shoulders formations. The clearer the structure and the more obvious it is to retail, the more prone to manipulation.
"The true powerful H&S or Three Drives is on the Daily. Those are where MMs intentions are clear, or what I call their 'footprints'. It's where your success rate when identifying it can be extremely high."
Using Wicks to Predict Liquidity Grabs
As mentioned, a wick can sometimes hold hidden liquidity. By checking lower timeframes, you can spot these hidden areas that sit above/under key HTF zones. These areas offer opportunities for precise, high R:R entries and can help protect you from being stopped out.
"Watch for Market Patterns: Study wicks as they indicate where MMs may push prices for liquidity grabs. But remember: it’s the HTF bodies that show real intent and order flow."
Confirmations of Intent
A long wick breaking structure and key liquidity levels is often designed to scare retail into selling/buying the bottom/top. Violent moves evoke irrational reactions. How do we filter out this noise? We wait for candle body closes.
Candle bodies give us a stronger confirmation of market makers' true intent. Again, volume is concentrated in bodies, not wicks.
For reliable signals, wait for 4H+ candle body closes above or below liquidity levels.
"Wait for 4H+ candle body closures above or below liquidity levels. If they don’t close the body and just a wick, it’s a false move."
"This is a good example of what i've explained several times before, with only wicks and no bodies closing past the BB, signaling a reversal."
📝 Remember, these are guides, not rigid rules. True mastery involves knowing when to bend the rules based on context.
Example: Moneytaur scrapped an entry when LTF signs of weakness (SOW) appeared before price reached his marked levels. The level was above a "no liquidity" zone, increasing risk. https://t.co/1CtO1VeM2Y
"If entering 'NO LIQUIDITY' area with a 2H+ body, it can ⚡️ up to -10%"
As you can see, his approach is fluid and intuitive, he reads and adapts to what the market is telling him.
- Bear market targets thesis -
The post I made yesterday ( https://t.co/IMcdP6i5zs) sparked a lot of mixed opinions, with many people already labeling me as a "perma-bear" making "random" predictions.
With this post, I want to explain the theory behind these numbers to help you understand that they weren’t generated by rolling dice but are derived from levels that have logical reasoning behind them.
First and foremost, it’s important to clarify that many of the targets extracted in my analyses stem from smart money concepts and, above all, are derived from AMT.
Therefore, it’s essential to have a good understanding of these two core principles to grasp the rationale behind the targets.
Before starting, have a quick look into this CME1! post for a "macro compass" -> https://t.co/hw4kbKxTJ0
- Bitcoin -
Let's start from the "king".
The post above is already a potential anticipation but of course you want to know the reason behind 28.360$, right?
Leaving aside the concept of CME that might be filled sooner or later, we one very HTF FVG formed in October 2023: the monthly one.
Inside of it, we can notice many different interesting areas:
- Bi-weekly HOB at 29.100$/29.400$
- Monthly HOB (called pure because it takes exclusively the open and the close of the April) between 28.476$ and 29.240$
- 4D HOB between 27.600$ and 27.700$
- The big bi-weekly OB between 27.490$ and 24.919$
The tendency from the market is often to rebalance HTF FVGs and to restore the imbalances created from buyers or sellers.
In this sense, the equilibrium plays a vital role and while the macro one is approximately at 42K, prices gravitate into discount areas during a bear market and in this context the 28K area becomes very appealing in my opinion.
28.360$ is the equilibrium of the monthly swing, the one that led to that big monthly FVG.
- Ethereum -
If Bitcoin comes down it's pretty logical that each asset goes down too, right?
And Ethereum has only 1 level that "fits" with Bitcoin at 28K: 1.700$
Why?
Even this one has been created in October and it's a weekly block + 0.705 Fib inside a weekly OB.
That is the only and most appealing level above the 2022 bear market lows, pretty much aligned with seeing Bitcoin at 28K.
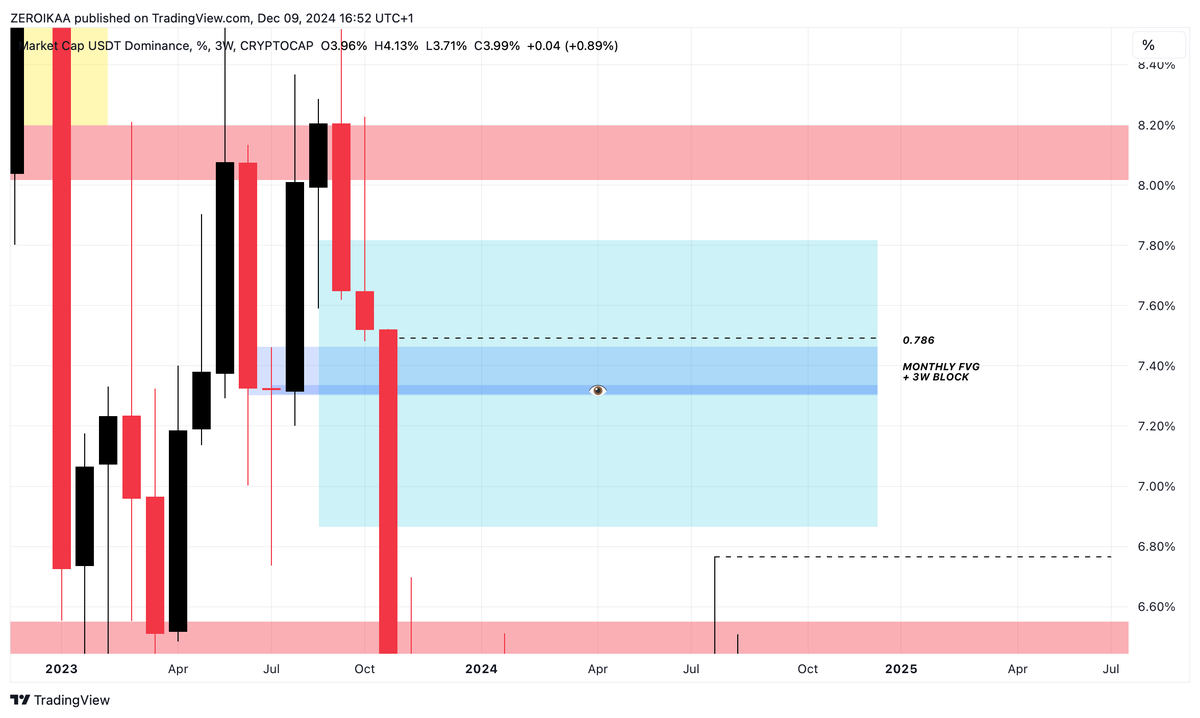
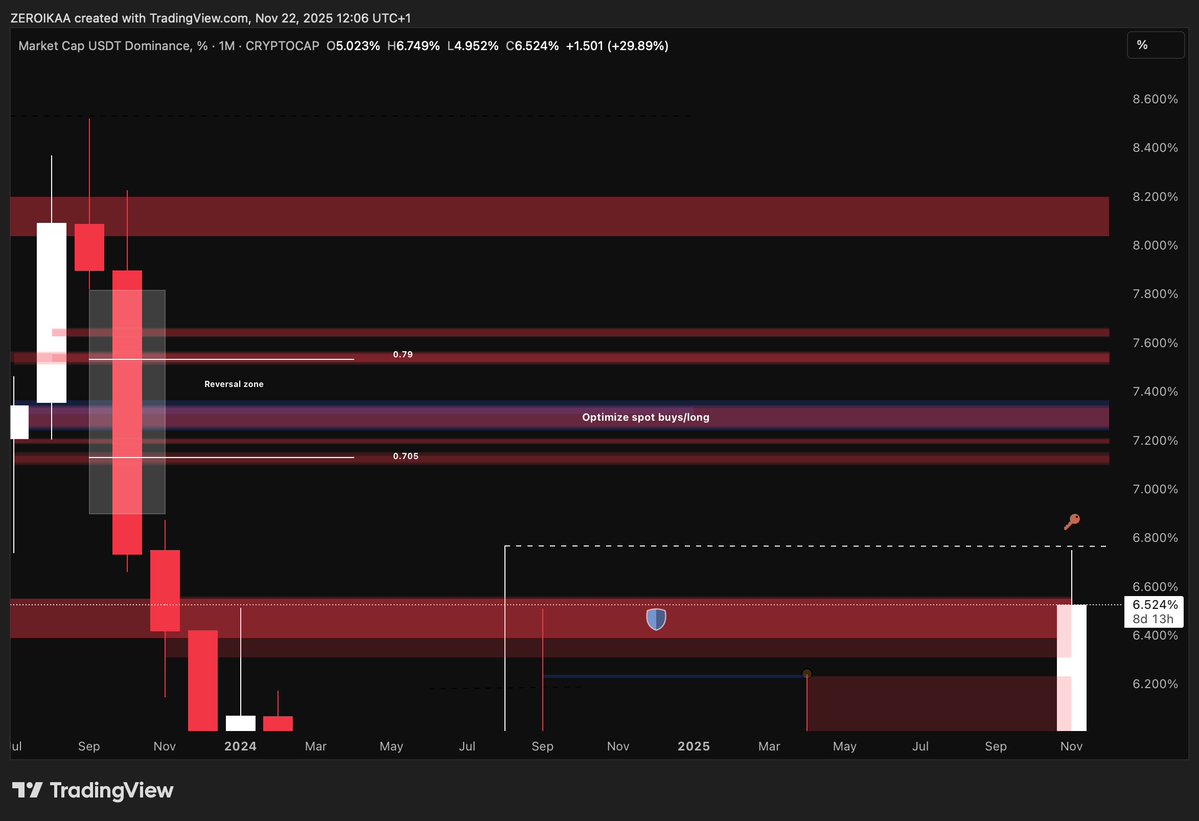
- USDT D -
As you know, one of the most important charts to use as confluence for finding interesting areas is surely the dominance of USDT, and in this case I'm relying on a 3-weeks block + 0.786 inside a monthly FVG.
Even this one has been generated in October (notice that everything fits?) and while the 3 week block stands at 7.30% it takes time for a potential bottom to occur, ideally with wicks, and that's why I'm targeting the 7.50% as wick extension.
- TOTAL -
TOTAL therefore should catch that 3W block + 0.618 Fib, slightly above the 3W OB.
It's a matter of confluence.
- Final conclusions -
I never rely on fundamentals to make analyses and even this time, I won't.
I already explained everything regarding the ETFs, Donald Trump's policy and similar stories that to me remain as such: stories to make people believe there's a "reason" behind price appreciation forcing them to remain in the loop forever while providing exit liquidity.
Regardless that you believe or not in these targets, the goal of this post is to simulate a rational approach and evaluate a potential downside that always finds its place in financial markets.
What goes up must come down and vice-versa, is the law of the market.
I don't know if these targets will be hit, this is my main thesis based on data and a personal explanation, nothing else and nothing more.
Could I be wrong? Of course I can, I'm not "Nostradamus" and I'm more than open to admit if I'm wrong, it's part of the journey to be wrong and learn from mistakes.
But at the same time is important to have a thesis, and this is mine, purely based on PA.
Looking for immeasurable value posts related to trading? I got you covered.
General concepts by @IamZeroIka
https://t.co/iZ0jz2iWoB
Hidden Liquidity by @Moneytaur_ (IMO this tweet opened the eyes for A LOT of people)
https://t.co/UFazpIDrns
Hidden Liquidity by @TraderDune
https://t.co/KZI1QYEJdO
Fibonacci Reverse Sequence by @IamZeroIka
https://t.co/2oYSOS2vuZ
Confluences by @CryptoChase02
https://t.co/UqWiHmWp4I
Confirmations by @TraderDune
https://t.co/Pf5HM6Bl7k
Refinement by @CryptoChase02
https://t.co/0DV5Y5cFhG
You might also want to consider reading my post about different quality levels of hidden liquidity:
https://t.co/vbtUXIuM1o
Now, what are you waiting for? Study! ;)
Plan continuation went really good.
In here, apart from the idea itself, there was the confluence provided by the big conjunction mentioned, therefore found in the opposite side of the market where most charts (T2/OTHERS/OTHERS D.) were taking their major levels alongside plenty of HTF breakers on individual altcoins.
When you make a plan and organize your trades, I will never stop to repeat it, the most difficult thing is context as finding levels is something that everyone can do, but the experience that it takes to contextualize everything..well, that is another different beast.
For this reason yesterday I also posted a video explaining you my BTC thought process "in-tandem" with this update that I highly suggest you watching if you missed out on it: https://t.co/xqCUnqHcNh
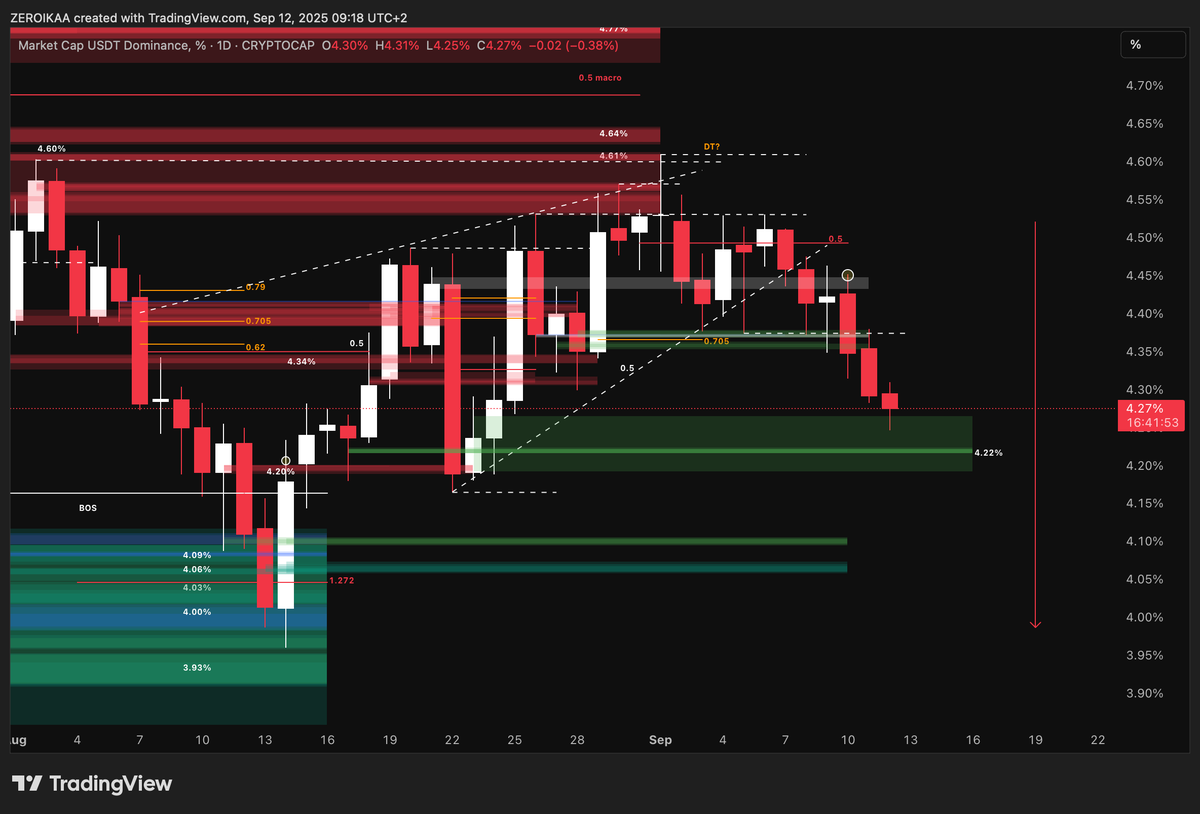
Now as you can see we broke down from the HTF rising wedge where the demand at 4.37% provided a decent reaction (useful for taking partial profits) but during the push down, 4.44% (white rectangle) perfectly acted as breaker to re-load and smash the demand (1D+2D) which was mitigated several times.
This breakdown is interesting because has created a 12H BOS below the 4.37% key level and this a first promising sign.
In the meantime, as you can see, plenty of altcoins are performing extremely well with OTHERS + OTHERS D. that are breaking out and in this context altcoins can continue to perform while USDT D breaks down or consolidate.
4.22% now is a potential sensible area within a semi-HTF CBOB so in case we go there I would pay some attention cutting some partials on spot and longs to protect yourself in case the 4.35% area gets tested as a bearish breaker.
However, we're looking for a potential break of the 4.17% that will likely open the doors for the 4.07%/4.10%, levels created during Mid-August and that must be taken into consideration for at least partial take profits.
3.69% remains a level I'm closely watching as potential final target.