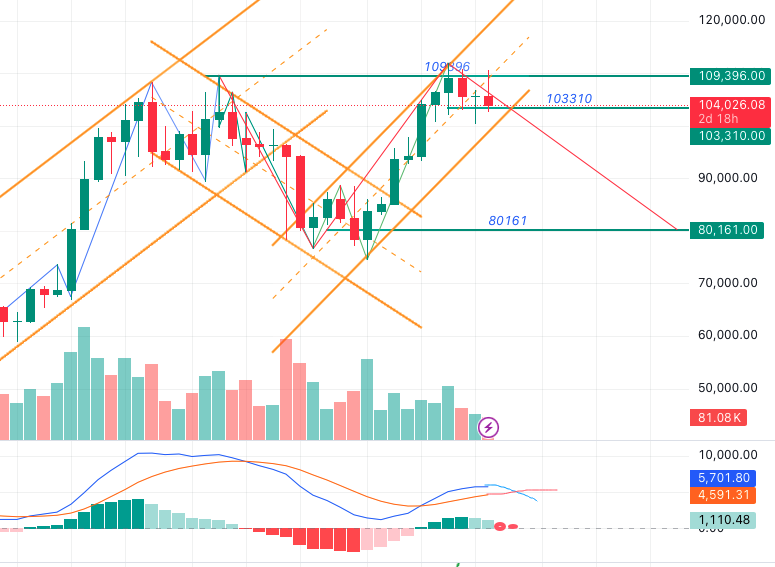
With two consecutive weekly red candles on BTC, the downtrend has become more apparent.
As the whales have already completed their short positions, the upcoming bearish move will be difficult to stop. The first target remains around $90,000.
If the price continues to fall below $80,000, the final target could potentially be in the $20,000–$40,000 range, with this move possibly unfolding over the next 1–2 years.
Making money work for you is the superpower of the wealthy. Ordinary people only trade their time for money. Once regular folks try to climb the social ladder by harnessing the magic of money generating more money, they may fall into an even deeper abyss.
As water drains from the pool, the fish within are bound to dwindle in number. Thus, new growth has not only dried up but will also keep shrinking. The future is destined for a prolonged game of stock competition, where smaller players get eaten by medium ones, medium by big ones, and big ones by even bigger ones. The best way to protect yourself is to stay out of the game entirely.
None of the money from sudden wealth may truly belong to you. Withdraw your funds and deposit them in banks, putting 500,000 in each one. Only when you spread your savings across 50 banks can the money truly be yours.
The Federal Reserve is about to shrink its balance sheet, bringing an end to quantitative easing that began in 2008. The 18‑year bull market for assets is over. Bitcoin is also entering a bear market with no new highs in sight. The original bull‑market narrative is about to be overturned, and a major reshuffling is imminent.
If you suddenly strike it rich someday, keep plenty of cash on hand. Don’t fall under the illusion that you’re invincible. Those who gamble to the end often end up with nothing.
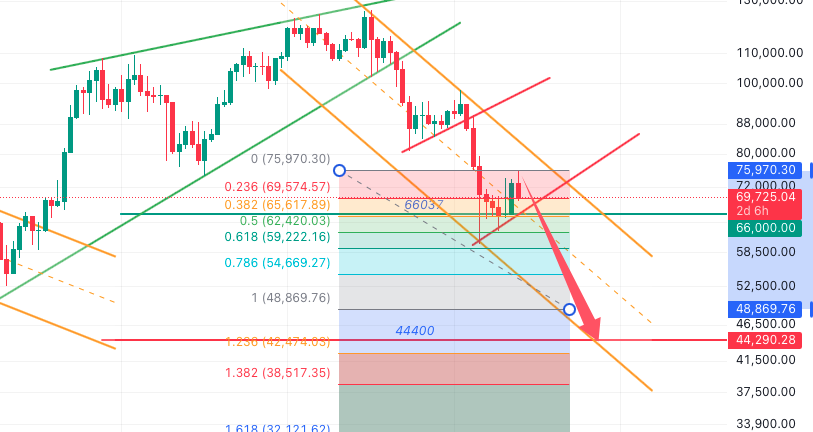
BTC has been ranging between 60,000 and 72,000. If this pullback can end around 63,000, we’ll see whether another rebound similar to the previous one can be replicated.
The current BTC rebound is over. If it pulls back to around 66,000 and then bounces, there will likely be another, larger downtrend afterward — a sustained decline.
In terms of strategy, favoring short positions should offer a much higher win rate.
My grid trading experiment is currently breakeven, effectively moving the original entry price from 90,300 up to around 92,500.
I’ve adjusted the grid range to 96,100–66,050. It should be able to keep running for a few more months.
In a bear market, trading the rebound is like trading the pullback in a bull market — exciting but never lasting. If you’re not someone with strong self-discipline, why not just go with the trend? If you want to earn more, you must accept higher risk.
#BTC has reached 90,000 USDT as expected, and next, my plan is to continue waiting for 80,000 USDT.
On October 21st, I mentioned that the first target for BTC was around 90,000, and it has basically been reached now, right? Next, we’ll see whether it breaks below the support line and heads toward the big test at 80,000. The forecast from a month ago still holds.
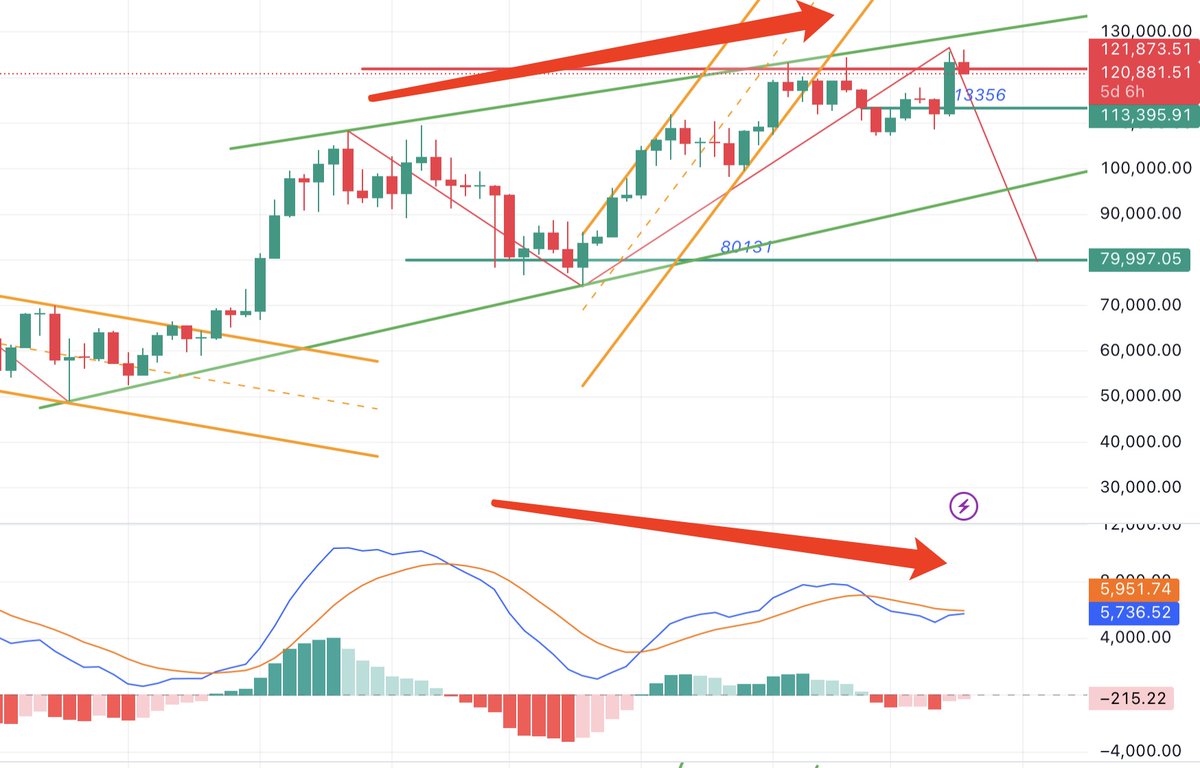
Now, after repeated rallies, if the weekly candle closes bearish, it will be difficult for the trend to reverse. Time to wait for the big, big, big correction!
It’s been two weeks without any market updates, and BTC has once again broken its previous high, reaching 124,470.
This marks the second time it has hit a new high again. We need to watch closely to see whether this pullback will break below 80,000.
Another 10 days have passed, and BTC hasn’t continued climbing for now.
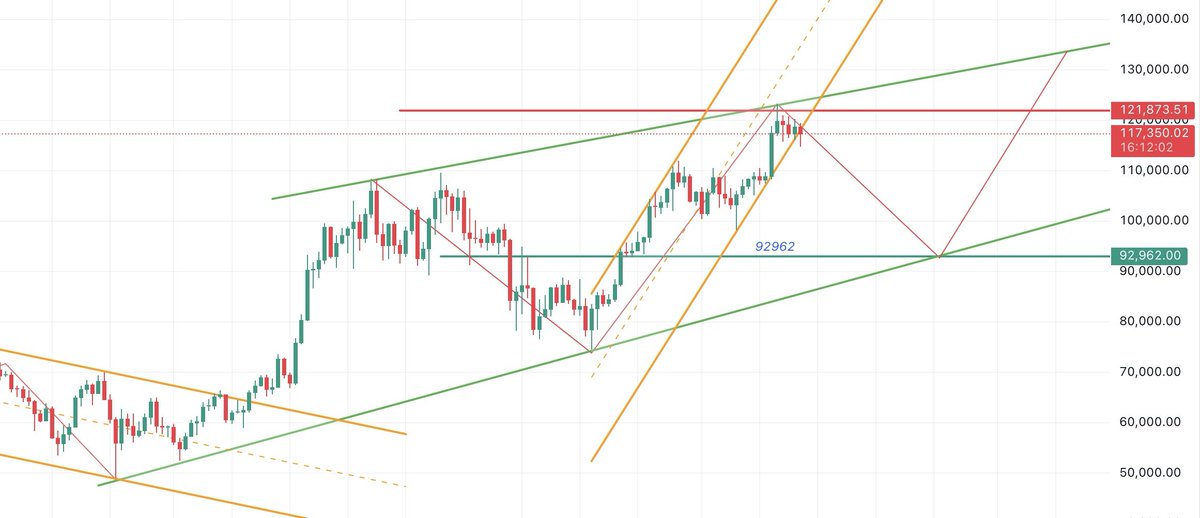
Let’s see if it can drop to $92,000 in October — there’s still plenty of time, two months to go. Just taking it step by step.
A minor pullback in BTC might have started, right?
For now, just watching from the sidelines to see if there’s still one more dip and one more rally. If it all plays out, it might not be finished until December — still five months to go.
The weekly MACD on BTC still hasn’t crossed bearish yet, so it looks like we’ll have to wait at least another 2 weeks.
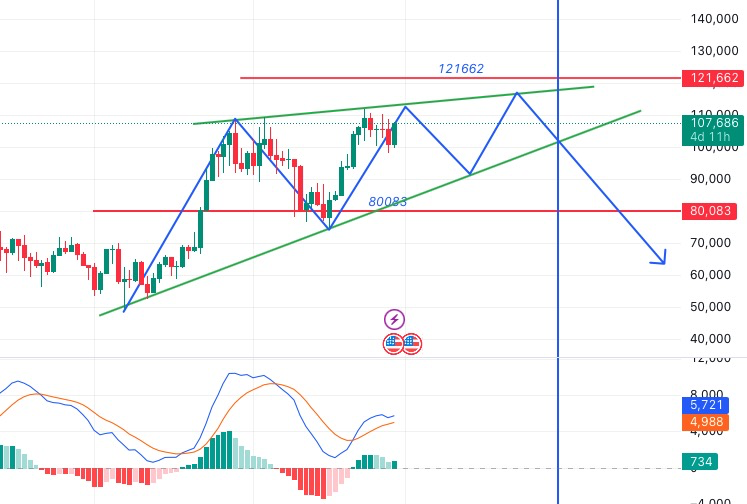
Even if there are still 2 more highs ahead, it doesn’t rule out the possibility of the entire 10-year bull market ending by January 2026.
Another week has passed, and there’s still not much change on the weekly chart.
BTC continues to fluctuate between 109 and 103.
The lower timeframes are still showing a downtrend — still waiting for the weekly MACD bearish crossover.
BTC is likely to continue its short-term pullback. Looking at the weekly chart, it will probably take at least 2 more weeks for a bearish crossover to form. We've had 7 consecutive bullish weekly candles, and this is only the third week of the pullback — likely need 4 more weeks.
BTC's decline seems to be truly starting. Still looking at a two-month drop lasting until July. Then a rebound followed by another drop — the whole year is likely to be a bearish one.
Last time, I thought BTC had topped out at 93,000 — I was wrong. Looking at it now, it seems to have completed a 5-wave pattern. For now, let's assume it's wave 2-c and keep watching to see if the upward move is really over.