NEW LEAK: Price sheet of 200+ crypto influencers and their wallet addresses from a project they were recently contacted by to promote.
From 160+ accounts who accepted the deal I only saw <5 accounts actually disclose the promotional posts as an advertisement.
@IamZeroIka@CryptoChase02@Moneytaur_ I get that @IamZeroIka . Thanx for replying. If you look at 9D OB marked by @CryptoChase02 , I observe liquidity sweep but no FVG and also no BOS. So would you say that even BOS is not a requirement for valid OB?
My understanding as per your Educational Content is that OB should have Liquidity Sweep and FVG due to strong impulse. Can OB have other manifestations. My understanding is marked on your chart. In case of @CryptoChase02 the wick of 1 covers the whole body of 2 and hence technically does not have FVG. This is the confusion @IamZeroIka
Let me start my day by proclaiming that @Moneytaur_ has unblocked me. I am very thankful Master. I am working hard to collate all the pearls of wisdom you have left in the trail. So far I was following a lot of your Mentees to gather your knowledge indirectly. With you opening the door, my journey will be accelerated. Thank you once again..😀
Here our CZ saying something bullish...All topsy turvy...I need a guru to negotiate the maze. @Moneytaur_ will you help by unblocking me first...please please...I have unfollowed all the fake ones...I think I can be adjusted amongst your followers...Thanx
Interesting to see perspective of two greats. @Moneytaur_ indicating meltdown here https://t.co/IBjO0D4wKu and @IamZeroIka indicating accumulation here https://t.co/J4blEiqR5b
Pupils like us confused...😇
Based on the behavior of several high volume coins on HTF, what I'm seeing is very interesting.
I'm noticing a shift in how volume is distributed, so no longer just sharp bursts of capitulation, but sustained, balanced inflows and outflows that suggest absorption rather than exhaustion, "price actionally" speaking.
When equal volumes appear at both extremes of price but the market refuses to break down further, it’s often a subtle sign that supply is being transferred into stronger hands.
Bearish candles with big bodies see no follow-through as increasingly bullish volumes (or equal ones) are absorbing them.
If I overlay this with the macro structure, many of these coins are sitting well below their HTF equilibrium levels, which means they’re trading at a discount.
In a true distribution phase, this would make little sense as distribution happens at premiums, not in discounted territory.
On the contrary, what I'm witnessing has all the hallmarks of accumulation: volume heavy ranges, almost muted volatility, and a market psychology dominated by disbelief.
From a psychological perspective, this is the stage where sentiment truly feels heavy, narratives skew negative, and people are quick to fade any rally.
I may be wrong, but putting everything into context and considering the last random pumps from certain coins (CRO and VVS for example) it wouldn't surprise me to see more of them pumping out of nowhere when people least expect it just to reverse them back when hype is high and these assets have reached their HTF supplies.
I was basing my theory on @IamZeroIka Educational content here https://t.co/FUrmEvi6Yh
I think I am still struggling with this OB thing. Zero says and shows liquidity sweep and FVG as important criterion. Similarly few other @Moneytaur_ mentees also. Can you discuss it little more please.
Educational content: Order Blocks.
I receive many questions about my perspective about OBs, so I decided to create an "ultimate" post that will help you understand my strategy.
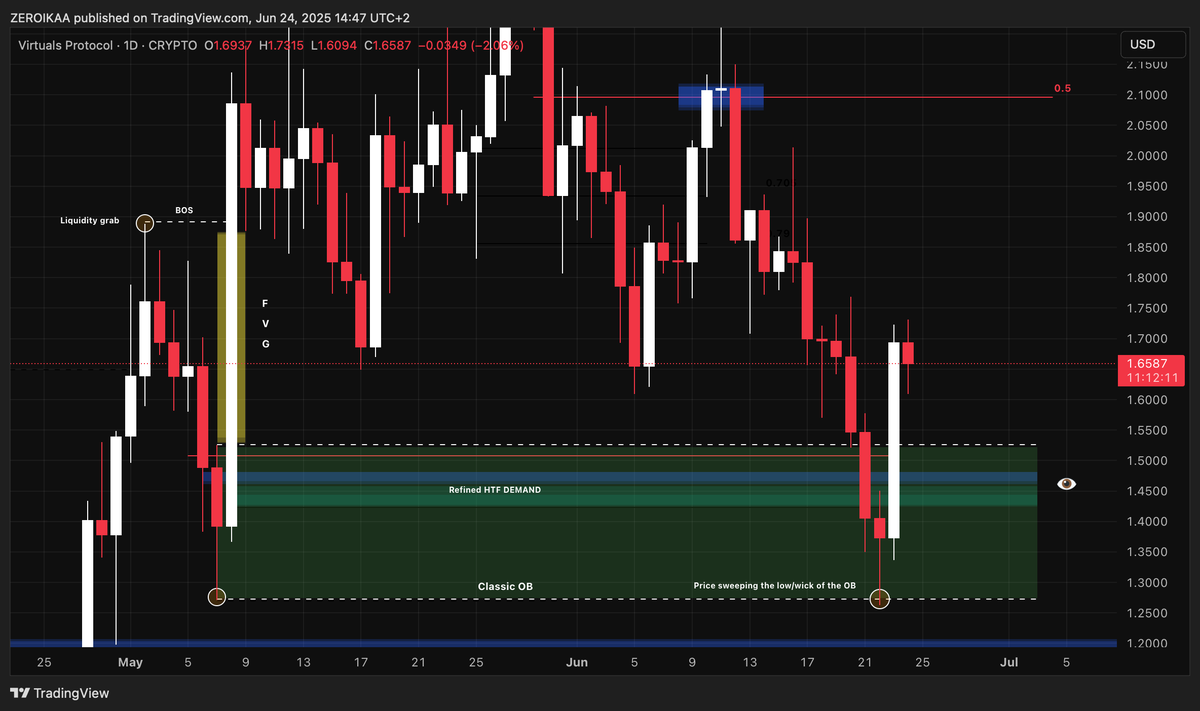
I grew up studying classic SMC and the way I always identified (and continue to do so) OBs is by including both candles and wicks, something I labeled as "classic OBs".
When smart money make a move, not every time is clean or confined to a single price level as they need liquidity (lots of it) and that liquidity tends to be scattered across a range, not at a precise point.
The wicks you're used to see, aren't just a reaction or a failed move.
They often represent the part of the price action where smart money were finalizing their entries or triggering liquidity to enable those entries.
In other words, the wicks are frequently where stop-losses were taken.
Institutions might drive price just above a high or below a low to grab that liquidity, and then reverse. (SSL/BSL)
The wicks, therefore, are part of their footprint and to me, ignoring them means ignoring part of the zone where real decisions were made.
The body shows where the majority of trading occurred, but the wicks show the intent: the manipulation or the hunt if you want to call them in this way.
In order to create a classic OB, what I want to see is:
- A valid BOS
- An inefficiency (FVG)
- A liquidity grab
- +1 (not necessary) -> The strength of the candle that originates the OB in order to assess more or less reliability of the OB -> smaller body candle/bigger body candle -> less/more strength of the OB
In this example you can see the formation of a classic OB respecting all the rules:
It's clearly evident that despite the strength of the candles that formed the OB, the price went down (retest/BB) going to sweep the liquidity located slightly below the previous low, the lower wick that formed the classic OB.
This could have given the perception that the OB was failing (price melting the bodies) when, in reality, the bigger demand zone was holding since we didn't have any candle bodies closing below the previous low.
This methodology helps you understanding the broader picture optimizing your sell/buys depending on the nature of the classic OB (bearish or bullish respectively).
The second method I use is more refined and relies on marking the EQ/0.5 of the OB, essentially focusing on the candle body alone as you can see from the chart below:
We had an HTF classic OB which acted as area of reference and I marked the EQ of the bodies where to expect a potential reaction and, as you can see, the price reacted almost perfectly.
This approach is particularly useful for sharpening entry points as, by narrowing the zone to just the body, wecan get tighter risk parameters and more precise execution, especially during intraday setups.
When price reacts powerfully to the EQ, and it aligns with other elements like LTF S&D zones or FVGs, it often leads to clean entries.
This is where I like to be more "surgical"...tight stops, defined invalidation, and strong R/R.
As stated, these concepts could be overlapped in order to find TP areas, like in the potential case of DOGE.
We have an HTF classic that, on lower TFs includes refined OBs, therefore valid levels to monitor in case we're looking for TPs or short positions especially if in confluence with majors.
I don't necessarily prefer one method over the other, rather, I choose based on context.
Classic OBs give me the breathing room to account for liquidity grabs and volatility, which is especially helpful in uncertain environments.
The EQ method, on the other hand, shines in structured and trending conditions where "sniper like" precision matters more. (and also for HTF TPs)
Neither method works in isolation, but when applied with narrative and structure in mind, they both serve as powerful tools in building high probability setups.
Context is everything, and that is the hardest part for the majority because true precision in trading isn’t found in rigid rules but it’s more forged through the ability to read context, adapt, and act with intent.
@CryptoChase02 I am asking about OB. The two candles in yellow box. The wick of red covers the body of next green. In my understanding OB should have liquidity sweep and then FVG. I may be wrong.
@CryptoChase02 My chart looks exactly like yours. Thanks for all the help and guidance. Can you have a look at DOGE? What to make of the wick on Daily..where was the OB? I will be thankful..😊😊