MY FATHER SPENT 32 YEARS STUDYING MARKETS AND LEFT ME 12 RULES
Most people learn these the expensive way
Price falls 5% → Hold
Price falls 15% → Buy 10%
Price falls 25% → Buy 20%
Price falls 40% → Buy 30%
Price falls 60% → Buy 40%
Price rises 5% → Hold
Price rises 20% → Hold
Price rises 25% → Sell 10%
Price rises 40% → Sell 20%
Price rises 50% → Sell 35%
Price rises 70% → Sell 40%
Price rises 100% → Sell 90%
Always keep 10% as a moonbag
Never go all in, never go all out
Simple framework, almost nobody follows it
Follow me - the people who do tend not to regret it
TonyRESEARCH Predictions for 2026:
1. SILVER hits $100 - $120, new ATH
2. GOLD reaches $6100, new ATH
3. Jerome Powell is replaced as FED Chair
4. The new FED chief aggressively cuts interest rates
5. The next major exchange collapse
6. GTA 6 gets delayed again
7. Bitcoin bottoms between $39K–$50K
8. Altcoins crash 60 - 70% across the board
9. Tesla successfully launches robotaxis
10. Commercial Real Estate vacancy jumps to 25 - 30%
11. USD falls off a cliff
Let’s see how this all plays out.
For those who are new here - I’ve been predicting market tops and bottoms for the last 10 years, with only minor mistakes.
The next big move will also be posted right here.
If you’re still not following me… you’ll regret it.
THIS $BTC PATTERN SHOULD SCARE YOU
Bear markets last ~406 days on average
Bull markets last ~1,064 days
We are 210 days into this one
But the crowd is already calling the bottom
They do this every single cycle
It never ends well for them
Turn on notifications - next update drops soon
🚨 BITCOIN IS PERFECTLY REPEATING 2022 SCENARIO
Look at the side-by-side weekly chart:
2022: cycle top -> MA ribbon flipped resistance -> bull trap rejection at EMA50/100 -> final flush to $15.5k bottom
2026: cycle top at $126k -> MA ribbon flipped resistance -> currently testing EMA50/100 from below at $80.8k
The setup, the structure and the moving averages are aligned exactly the same way
Last cycle the bull trap rejection at the MA cluster triggered a 60% drop into the actual bottom
If the analogy holds, the projected target sits in the $40k-50k zone by Q4 2026
Two scenarios from here:
1. Reject from EMA50/100 confluence around $81-83k -> repeat the 2022 leg -> flush into $40-50k zone
2. Weekly close above the EMA200 -> invalidates the analogy -> bear market structure breaks
Invalidation is clean: a weekly close above $90k flips the entire bear thesis
Traders in our TG community already have some interesting setups for upcoming week, come check it out while they are still free:
https://t.co/sgCzWlXKin
My take on bitcoin:native rn:
Maybe one more push to $85K. Maybe not. Either way, it's not a trade.
The trade is doing nothing for the next 3 months.
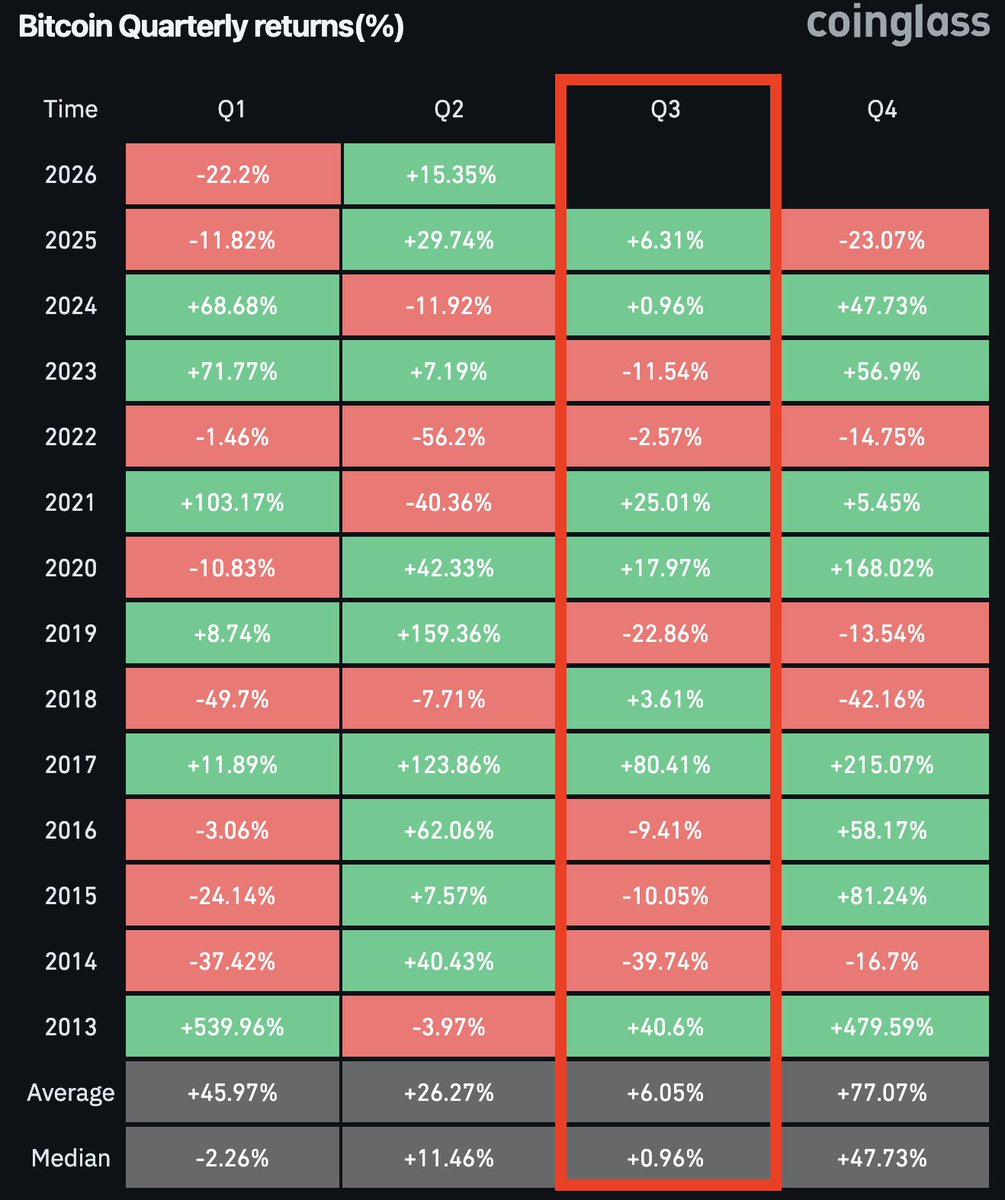
"Sell in May" isn't a meme.
AVG Q3: +6% (far the worst)
AVG Q4: +77% (far the best)
Same window opens now.
$40-$50k waiting room.
🚨 MY FULL MARKET PREDICTION FOR 2026-2027
May-June 2026
- $BTC drops below $58K, panic peaks
- $ETH toward $1,600, S&P 500 below $6,800
Q3 2026
- $BTC forms the bottom, whales start accumulating
- Fed leadership change triggers the sharpest drop
- First rate cut arrives, distrust in crypto hits maximum
- S&P 500 slides toward $5,200
Q4 2026
- $BTC starts a new uptrend, reclaims $90K+
- AI x crypto narratives bring millions of new participants
- QE launches amid global crisis, liquidity floods back in
Q1-Q4 2027
- $BTC breaks ATH, $140K+
- Becomes the #1 safe haven asset globally
- Real estate cracks in at least 3 major US cities
- Those who bought in Q3 2026 are up 3x within a year
Save this post
Follow me - I'll be tracking every step in real time
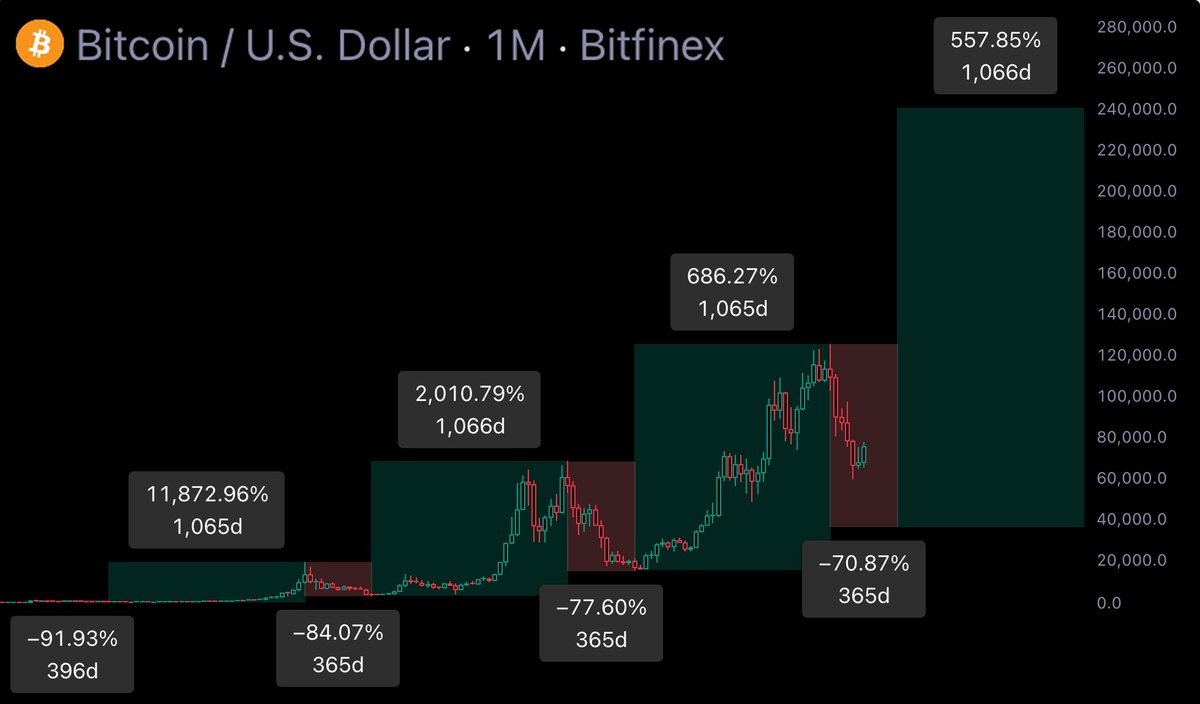
$BTC cycles:
2015–17: 12 Jan -> 11 Dec: 1065 days
2017–18: 11 Dec -> 10 Dec: 365 days
2018–21: 10 Dec -> 8 Nov: 1066 days
2021–22: 8 Nov -> 7 Nov: 365 days
2022–25: 7 Nov -> 6 Oct: 1065 days
2025–26: 6 Oct -> 5 Oct: 365 days
This article will change how you look at holding BTC:
🚨 THIS IS VERY BAD!
The market is repeating the same pattern again - but most traders are blind to it.
Bitcoin just entered the second stage of the trap: the fake recovery.
Phase 1: Crash (-54%) → DONE
Phase 2: Fake recovery → WE ARE HERE
Phase 3: Real bottom → LOADING
Retail is buying, whales are unloading.
Bear trap → shorts wiped
Bull trap → longs buried
The same pattern played out in 2022 - and it’s happening again.
Before the real bottom, one more painful drop will clean out the last believers.
EVERYTHING IS GOING ACCORDING TO MY PLAN, DON’T WORRY.
TURN ON NOTIFS, FOLLOW & BOOKMARK!
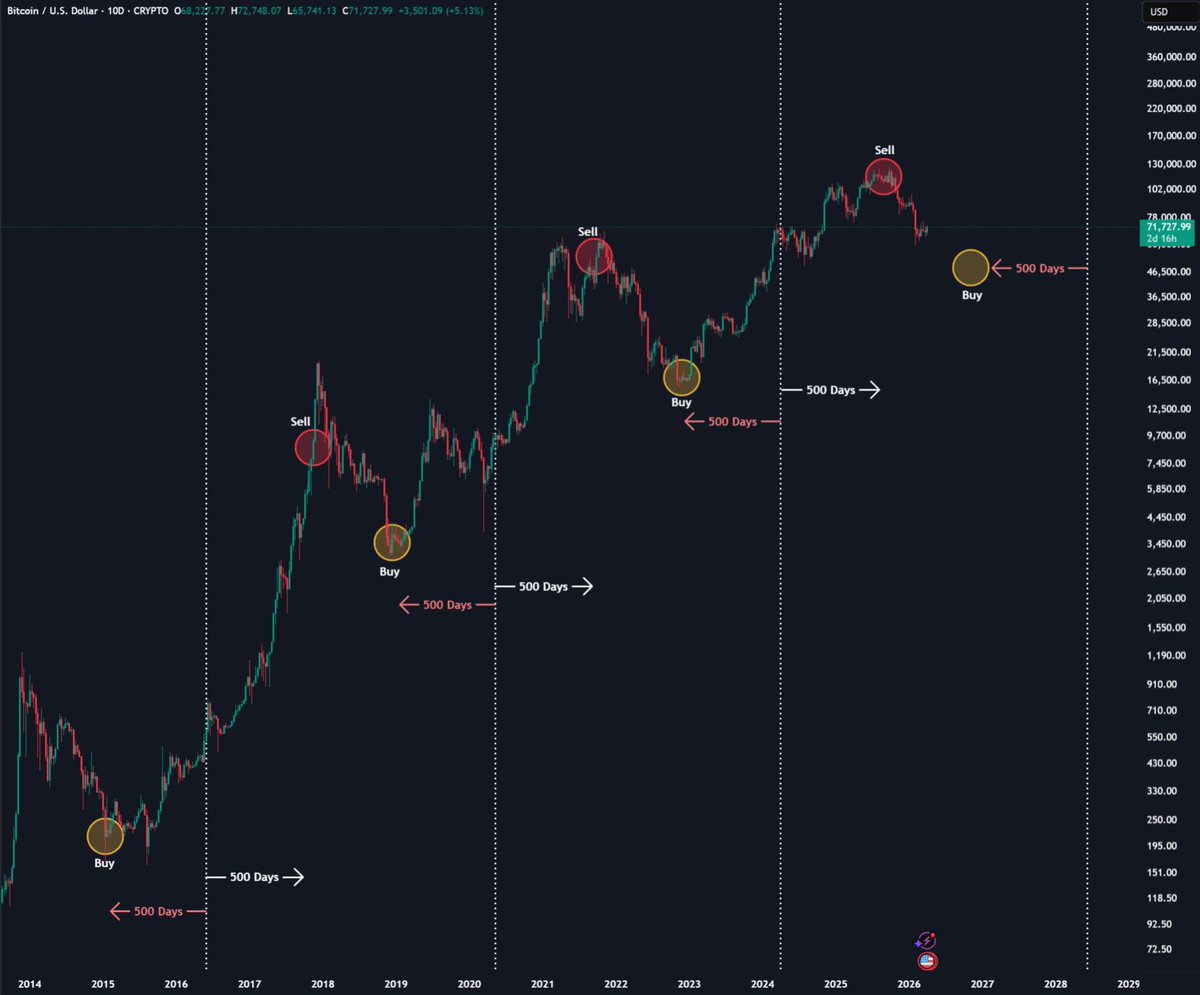
🚨 YOU DON'T NEED TO BE A GENIUS TO PRINT MONEY ON $BTC!
$BTC BELOW MA200 → BUY & ACCUMULATE
$BTC BREAKS ABOVE MA200 → SELL ON 1000 DAYS
THIS BEATS 97% CRYPTO TRADERS OVER 4 YEARS
EVERYTHING IS GOING ACCORDING TO MY PLAN, DONT WORRY
TURN ON NOTIFS, FOLLOW & BOOKMARK!
🚨 Bitcoin stuck at $65K-$68K for a reason
This isn't random. This is Bitcoin history repeating.
If you know the past, you know the future:
2017: Base formed → Parabolic expansion
2021: Base formed → Parabolic expansion
2026: Same structure playing out NOW
This range = accumulation phase before the breakout.
I called the $126k ATH. Every major top and bottom.
The pattern is IDENTICAL.
I'll call the breakout and new ATH live. Turn on notifications.