Development is officially complete. 🛠️✅ $BTC $ETH $SOL
Some might call it overengineered. I call it built exactly right for sophisticated traders on a sophisticated platform.
After more than a month of intense work, the Orderflow Bubbles indicator is finally 110% done. It features insane customization options and an ultra-precise auto-filter, fully adjustable across 7 perfectly tuned levels. 🫧⚙️
A detailed video breakdown and full documentation are coming next. Give me a little time to get everything perfectly ready for you, traders.
I’ll be releasing this indicator on MMT completely for FREE. All I ask in return is your support on social media. It costs nothing but a quick moment of your time. 🤝
More info dropping soon. Thank you for the massive support lately and the growth of this account. ❤️📈
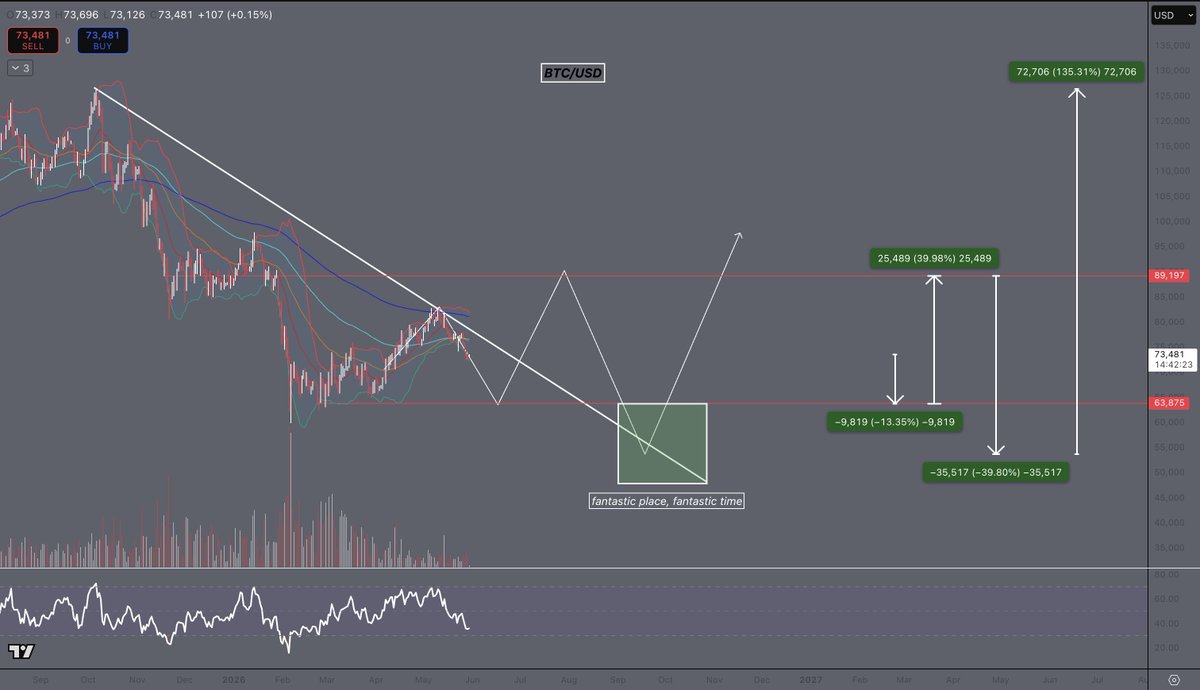
fortunes will be made.. fortunes will be lost.
clocking out for summer, will check-in when alarms hit at key inflection points or if smth really cool happens :)
Have a great summer everyone
Jane Street pays $750k/ year for quants who can answer how to use Stochastic Process and Markov Chains in quant trading.
This 1-hour MIT lecture on probability gives you the same insights quants get paid $60K/month for.
Bookmark & watch today. Then read the article below.
a quant at a prop firm showed me a 5x5 grid on a napkin
said:
> this is our entire edge. we don't predict price. we predict which box the market is in and where that box historically leads
i didn't understand it for weeks. then it clicked
never looked at a chart the same way since
grid is called a Markov Chain transition matrix. the math is from 1906, it's in every probability textbook on earth
and hedge funds use it because it asks a completely different question than retail traders ever ask
retail: will this go up or down
quant: what state is this market in, and where does this state typically go
every market lives in one of maybe 5-6 states at any given moment
tight range, volatility compression, trending with momentum, post-spike reversal, pre-breakout coil
not random labels - clusters you identify from actual data using volatility, volume, and momentum readings stacked together
once you have the states, you build the matrix:
P(state 2 -> state 4) = 73%
P(state 4 -> state 1) = 61%
P(state 1 -> state 3) = 68%
each cell is a historical probability. now when the market is in state 2, you're not guessing
you're betting on 73% historical completion. you size it with Kelly. you take the trade when the math says to, not when it feels right
i built this on BTC using 2 years of 4-hour data. identified 5 states
one i labeled "volatility compression below 20-day mean for 6+ consecutive candles" transitioned to a directional move above 1.8 ATR in 71% of cases
average reward/risk on those trades: 5.4
that's not prediction. that's reading a probability table the market keeps filling in for you every single day
the part that should bother you: the data to build this is free. the framework is in any quant textbook
python to implement it is maybe 200 lines
what Renaissance Technologies has that you don't isn't secret data or proprietary signals
it's this framework applied to higher-resolution data with more sophisticated state definitions
you're not missing information
you're asking the wrong question every single time you open a chart
Order Flow is a great tool that is tossed around in the futures space a lot, but it can be complicated.
Order Flow can be noisy, it can throw people off, so I broke down my thoughts on how traders can weave through the noise and look for the nuggets
Have said this for a year now. But if you aren’t trading stocks you’re doing yourself a huge disservice.
There’s going to be a few big boom and bust cycles. It’s going to be volatile so be warned. but AI is going to revolutionize every part of our lives. From agriculture and health/medicine, to general businesses , space travel, defense, robotics and anything you can possibly imagine. We are only in year 2 of this. It’s like finding crypto in 2014 in some ways.
Claude Code x TradingView is the best AI trading quant of all time.
Gone are the days of AI slop market analysis - AI is now better at technical analysis than you.
Here's how you can turn Claude Code into your expert trading quant (in <5 minutes):
Step 1. Ensure you have these requirements:
• Claude Code - installed on your computer (this is what talks to TradingView)
• Node.js 18+ - installed on your computer (the MCP server runs on this)
• TradingView Desktop app - downloaded from https://t.co/1YkJpaCU8L
• A valid TradingView subscription (paid plan for real-time data)
Step 2. Open Claude Code and run the following prompt to connect the TradingView MCP:
"Install the TradingView MCP server. Clone and explore https://t.co/k1Ql1o0CYi, run npm install, add to my MCP config at ~/.claude/.mcp.json, and launch TradingView with the debug port."
Step 3. Health check
Restart Claude Code, and paste this prompt:
"Use tv_health_check to confirm TradingView is connected."
If correctly connected, Claude Code should respond with a confirmation.
Step 4. Start prompting
Claude Code now has access to your ENTIRE TradingView environment
Your charts, your technical analysis, alerts - everything.
Use this prompt to turn Claude Code into your personal market analyst:
"Act as an elite quantitative trader and technical analyst with full access to my TradingView environment.
Analyze the current market structure for [ASSET] on the following timeframes: 5m, 15m, 1H, 4H, 1D.
Use my existing indicators, drawings, and chart context to:
Identify the current trend and market regime (trending, ranging, accumulation, distribution)
Mark key support and resistance levels based on price action and liquidity
Identify liquidity pools, stop clusters, and likely areas of manipulation
Analyze momentum using RSI, MACD, and volume where available
Detect any chart patterns (breakouts, consolidations, deviations, etc.)
Evaluate confluence across timeframes
Then provide:
A clear directional bias (bullish, bearish, neutral)
The highest probability trade setup right now
Exact entry, stop loss, and take profit levels
Risk-to-reward ratio
Invalidation point (what would prove this analysis wrong)
Finally:
Explain your reasoning step-by-step in plain English.
Avoid generic statements. Be decisive.
If no high-quality setup exists, explicitly say “no trade” and explain why."
This is an EXTREMELY powerful setup - make sure to save this post so you don't forget it.
Every Trader needs to use Claude.
In this guide you'll get:
- The skill to build any trading indicator
- My custom Breakout indicator
- Real trade examples (not just theory)
I've included a cheatsheet too
Enjoy.
https://t.co/dQAVJ213gF


![milesdeutscher's tweet photo. Claude Code x TradingView is the best AI trading quant of all time.
Gone are the days of AI slop market analysis - AI is now better at technical analysis than you.
Here's how you can turn Claude Code into your expert trading quant (in <5 minutes):
Step 1. Ensure you have these requirements:
• Claude Code - installed on your computer (this is what talks to TradingView)
• Node.js 18+ - installed on your computer (the MCP server runs on this)
• TradingView Desktop app - downloaded from https://t.co/1YkJpaCU8L
• A valid TradingView subscription (paid plan for real-time data)
Step 2. Open Claude Code and run the following prompt to connect the TradingView MCP:
"Install the TradingView MCP server. Clone and explore https://t.co/k1Ql1o0CYi, run npm install, add to my MCP config at ~/.claude/.mcp.json, and launch TradingView with the debug port."
Step 3. Health check
Restart Claude Code, and paste this prompt:
"Use tv_health_check to confirm TradingView is connected."
If correctly connected, Claude Code should respond with a confirmation.
Step 4. Start prompting
Claude Code now has access to your ENTIRE TradingView environment
Your charts, your technical analysis, alerts - everything.
Use this prompt to turn Claude Code into your personal market analyst:
"Act as an elite quantitative trader and technical analyst with full access to my TradingView environment.
Analyze the current market structure for [ASSET] on the following timeframes: 5m, 15m, 1H, 4H, 1D.
Use my existing indicators, drawings, and chart context to:
Identify the current trend and market regime (trending, ranging, accumulation, distribution)
Mark key support and resistance levels based on price action and liquidity
Identify liquidity pools, stop clusters, and likely areas of manipulation
Analyze momentum using RSI, MACD, and volume where available
Detect any chart patterns (breakouts, consolidations, deviations, etc.)
Evaluate confluence across timeframes
Then provide:
A clear directional bias (bullish, bearish, neutral)
The highest probability trade setup right now
Exact entry, stop loss, and take profit levels
Risk-to-reward ratio
Invalidation point (what would prove this analysis wrong)
Finally:
Explain your reasoning step-by-step in plain English.
Avoid generic statements. Be decisive.
If no high-quality setup exists, explicitly say “no trade” and explain why."
This is an EXTREMELY powerful setup - make sure to save this post so you don't forget it.](https://pbs.twimg.com/media/HHmjVwYa0AAubBu.jpg)


