Corporate student in Wealth Management at a major German investment bank. Crypto enthusiast sharing financial analyses and insights on trends shaping crypto.
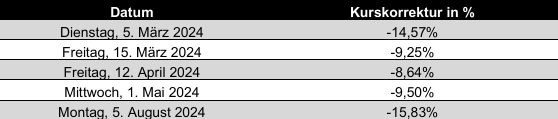
2) Why? Data from Coinglass & Glassnode shows ETF sales at $1.77B and spot sales at $624M. Despite low correlation (0.23), $ETF inflows aligned with 3/5 major $BTC drops, amplifying volatility in specific conditions.
1) $BTC $ETFs significantly influence BTC prices. High ETF sell volumes often correlate with sharp price drops in spot markets. For example, on key sell-off days, BTC prices dropped as much as -15.83%, indicating potential market-wide effects tied to ETF activity.
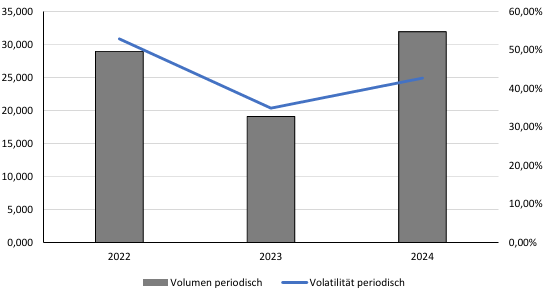
2) Rising liquidity and lower volatility (from 52.92% in 2022 to 42.70% in 2024) are stabilizing $BTC. More participants mean less price manipulation. Volatility, calculated via daily standard deviation, indicates a healthier market trend with reduced impact from large trades.
1) The $BTC $ETF launch has significantly increased daily trading volume: $28.976B in 2022, $19.099B in 2023, and $31.937B in 2024. This 10.22% rise in liquidity strengthens Bitcoin’s market stability, making it more robust for faster and steadier transactions.
2) Projecting gold’s 8.9% CAGR onto $BTC, we see potential for significant returns. Increased liquidity could attract new investors and fuel BTC's rise.
1) $BTC market cap could hit $2T by 2030, echoing gold’s growth post-ETF launch. Given similar conditions, BTC shows high potential. As ETF demand rises, so does BTC liquidity, paving the way for substantial market growth.
$STBU showing potential reversal signs. With cooling BTC.D and the Liquidity shifting to $ALTS, the probability is high of positive future return.
With an Average Volatility of 180% p.A i expect an explosive move soon.