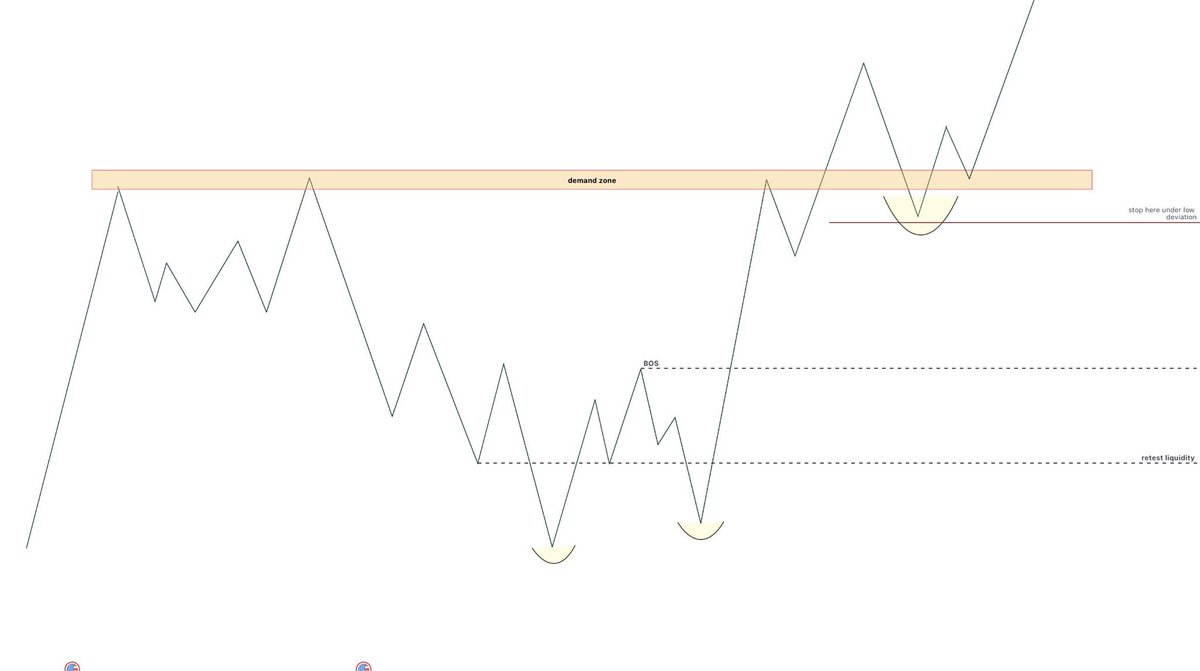
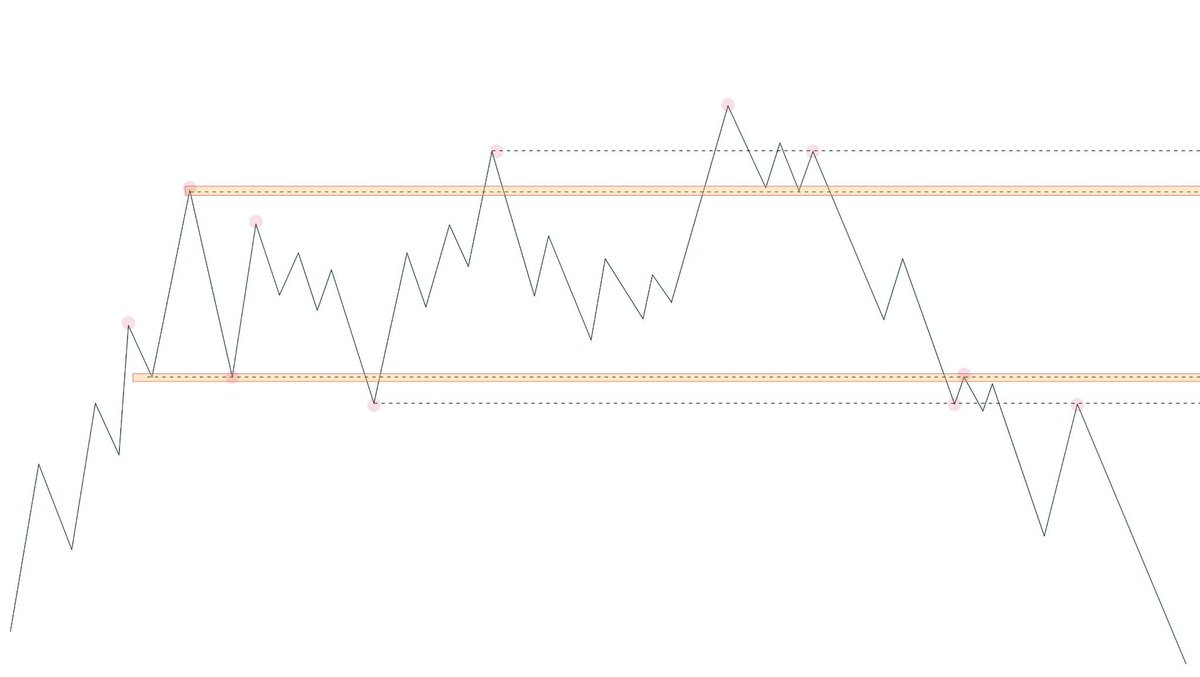
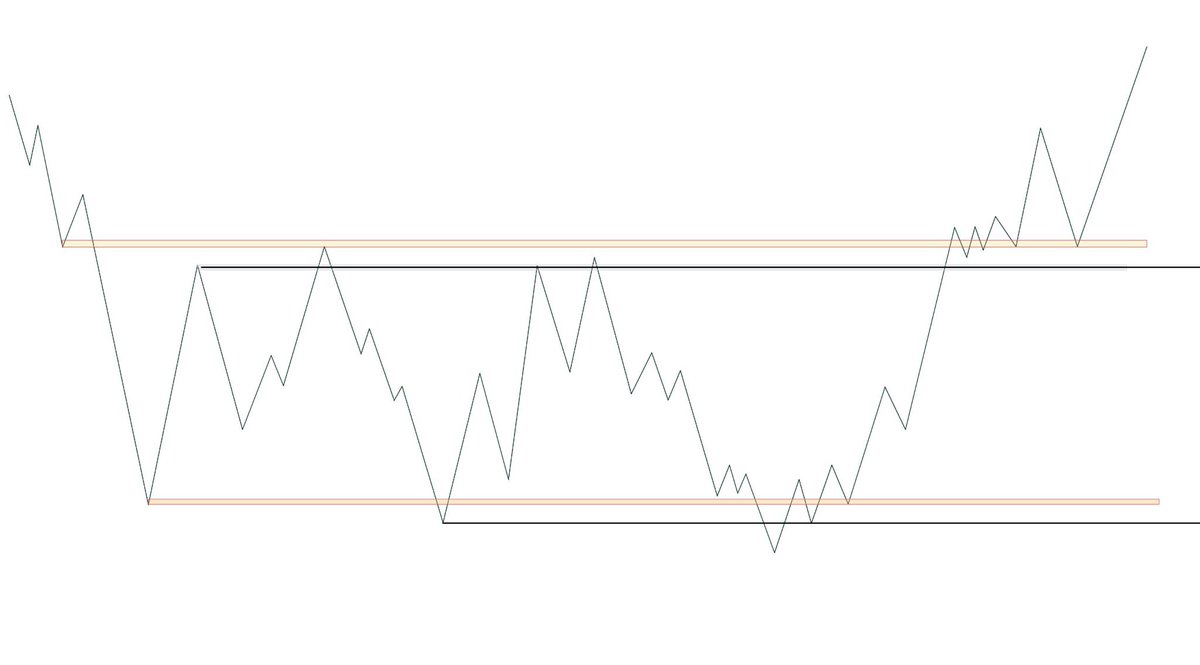
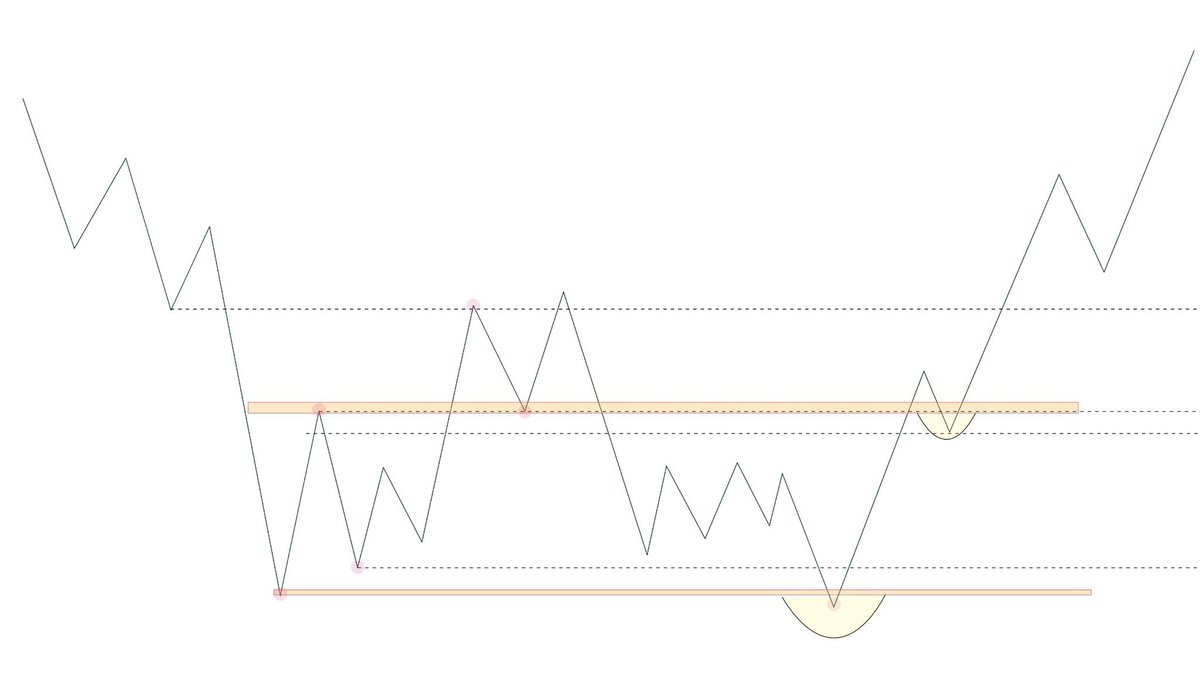
Support and resistance levels are among the simplest yet most misunderstood concepts in technical analysis. The longer a price zone holds over time, the greater its practical significance tends to be. The difference between an inexperienced trader and an experienced one lies in their approach: the former seeks the perfect level, whilst the latter observes how the market reacts within a zone of interest.
Liquidity sweeps, deviations, reclaims and structural confirmations are often the elements that allow us to distinguish a simple reaction from a high-probability opportunity.
Ultimately, support and resistance levels are not used to predict the future, but to identify areas where it is worth paying closer attention and waiting for the market to reveal its intentions.
Study these slides and they will be useful to you
A retweet would be helpful
🔥 HOLIDAY GIVEAWAY! 🔥
Win a 1 YEAR FREE MEMBERSHIP with @WealthGroup!
To enter, complete all 3 steps:
⭐ Like & Retweet
⭐ Follow @WealthGroup
⭐ Tag 3 friends
Winner picked Jan 12th! 🏆
I want to clarify something
I’ve already explained it several times, but it’s better to repeat it, otherwise some “kids” start imagining things.
The 0.75 level (which now everyone suddenly uses, even though nobody cared about it before) must be used together with other confluences.
It’s not enough to draw a Fibonacci, mark the 0.75 and jump into a position.
That’s not how it works.
You need multiple confirmations to make this strategy truly profitable …structure, volume behavior, context, liquidity dynamics, and intention from the market.
Let’s see how far this tweet goes.
If it gets enough traction, in the next 48 hours I’ll post a full video breaking down my entire strategy
If you think I am one of the best #crypto trading accounts on twitter, that people interested in the topic should certainly follow please
👉 LIKE
👉Retweet
(trying to break the shadow-ban algo, and gain followers for this first time in 7 months)
$BTC
#Bitcoin#eth
$eth
#altcoin
Though we didn't experience the anticipated fast grab at 28k, we did make a dive at 27k. The 3-day liquidity heatmap was remarkably accurate at the 25.6k liquidity level - we plunged headfirst into the pool and took a substantial chunk as demonstrated in the before-and-after liquidity heatmap snapshots.
As always, remember that liquidity is inherently dynamic; traders continuously adapt and shift their positions. Don't rely solely on these insights - use them to complement your own technical analysis. It's not prophecy but a fluid reflection of traders' buying/selling activities.
Stay tuned for my long-term technical analysis coming later today!
#TradingInsights #LiquidityHeatmap #Crypto #BTC #ETH #XRP #SEC #Binance
$BTC Intraday plan update.
Ending diagonal to achieve this Big ABC consolidation pattern is still valid so far.
With what I see on LTF, another move down is likely soon, maybe one more scam pump in LTF then sent it down, let's see ✍️🏼