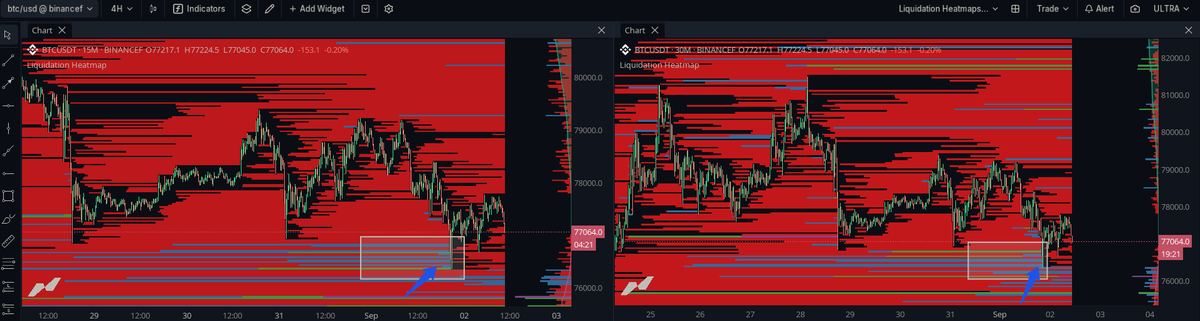
Mini range lows got cleaned and price bounced almost 2% - shocking, right
Liquidity did what liquidity does.
That is why I care more about where stops are sitting than random candle opinions.
Level, context, reaction.
#NZC
Weekend prep starts now!
One thing to understand before the week opens: funding.
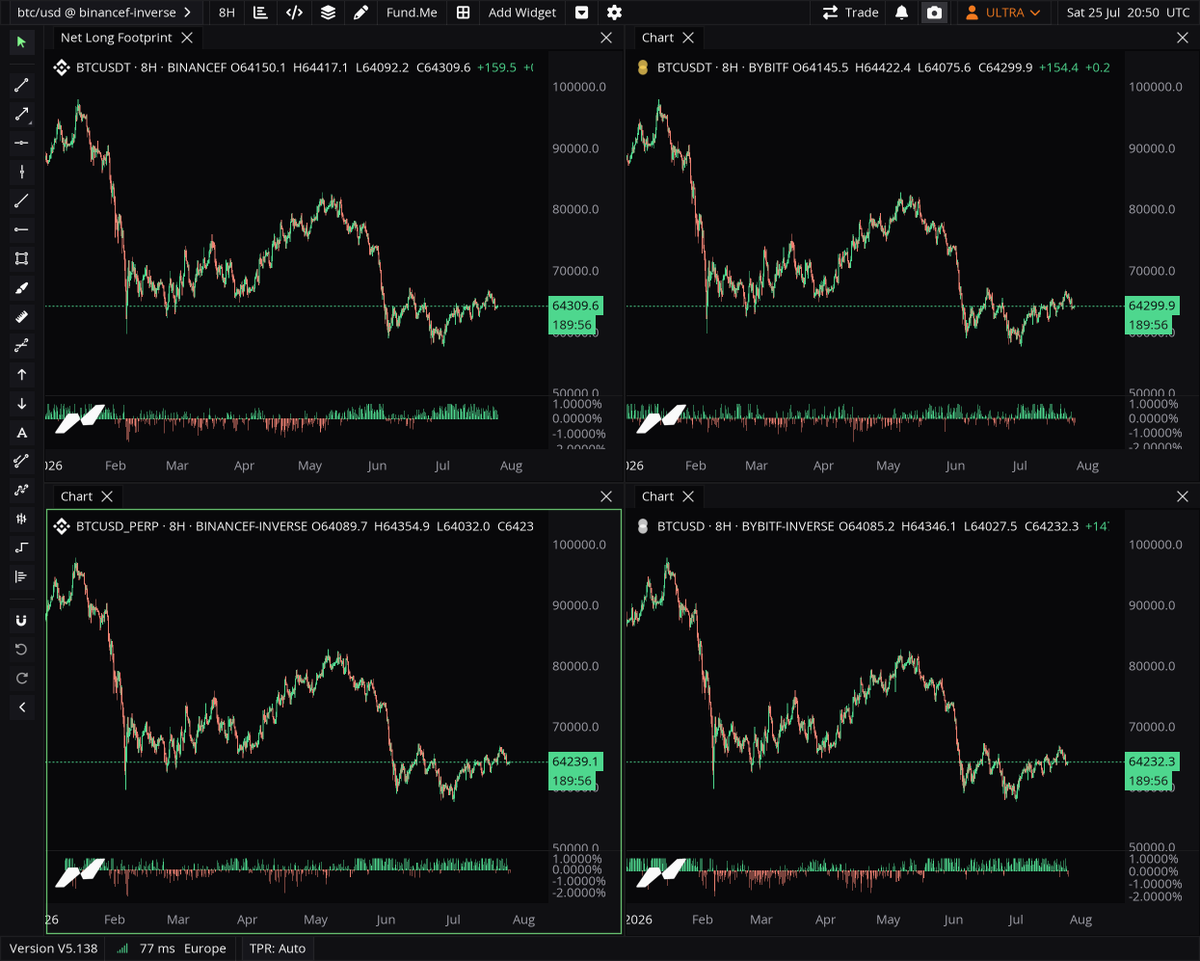
Funding has stayed positive through this entire decline. Price fell from 100K to 64K and longs kept paying to hold the whole way down.
Here is what that actually means.
Positive funding in a downtrend is not bullish. It is the opposite. It means the crowd refused to capitulate - they kept adding and holding longs into weakness, paying a premium to be positioned the wrong way.
That builds an overleveraged long side. And an overleveraged long side is fuel.
When those trapped longs finally give up - or get forced out - the liquidations cascade and accelerate price lower. The market tends to flush the crowd that would not let go.
For the week ahead: if funding stays positive while price weakens, the downside has fuel and the liquidation levels below become the target. If funding finally flips negative on a flush, that is often where capitulation completes and the real bottom forms.
Watch funding. It tells you when the crowd is trapped - and when they have finally let go.
Whale Bucket CVD 🧵
1/ Don't watch CVD as one line. That's a mistake.
Split it by trade size and you can see exactly who is buying and selling.
Here's what each bucket means, bookmark the tips!👇
Bid-ask
Bid-ask profiles can help identify local absorptions in a candle.
This post explains how we can do so below ↓
Relating the bid-ask to absorption we want to look for different reactions at the high or low of a candle.
At highs of candles, we want to see lots of asks being filled, resembling market buy orders but also showing defending liquidity from the books from the high volume of asks that were placed at limit.
For this we can look for P-shaped bid-ask profiles as shwon in the diagram below.
At lows of candles, look for lots of bids being filled to show market sellers being absorbed by the limit buy orders. Hence looking for d-shaped profiles.
Additional confirmation for an absorption reaction would be to look for this to occur within the wick of a candle showing that price moved away from the level afterwards.
@Exoticktrades At low of candles how do you approach a long entry? Do you enter as soon as you see absorption, do you wait for a retest of the d profile, or do you wait for a candle close? Thanks.
@Luckshuryy Cool! In this scenario , how do you approach a long trade? Do you enter as soon as the candle breaks the short level or do you wait for a retest of that level? Thanks
Successful traders focus on 1 setup and master that setup.
Amateur traders focus on 27 setups and master nothing.
1 setup is enough to kill in the trading arena.
Trading is crazy.
Moving averages.
Bollinger Bands.
Stochastic.
Ichimoku.
MACD.
RSI.
You just need an horizontal line.
Stop overcomplicating your trading.