Ever wondered how the EsportFire300 is actually weighted?
Took the current Buff prices and put together the top 15 items (out of 300).
They account for 38.7% of the total index value.
Shoutout to @esportfirecom for the index itself 🔥
The SteamDT Market Index can be manipulated without selling a single item.
The methodology is fundamentally flawed. Nevertheless, I see many people using it for assessing the current market state.
It’s about the weights. Indices are generally built as price * weight, summed across all items of the index. If the weight does not make sense, the index does not make sense.
SteamDT's English site says weights are assigned "based on the total number of skins sold online." (hover over the market index on their homepage). That's a misleading translation. The Chinese original says "全网在售数量" = number of active listings across all platforms, not number of items sold.
This means for every skin in the index, they look at the number of listings and multiply it with the current price. This leads to two problems:
1. Easy manipulation: if you increase the number of listings by listing items way above market prices (so they don't even get sold), the index value goes up.
2. Non-representative index movements without manipulation.
Let's imagine a crash (I know, far-fetched).
What would happen if prices drop? Right.
People panic-sell their items.
This translates to increased listings, countering the drop in price that would otherwise push the index further down.
The opposite happens as prices soar. Listings are bought up, which hinders the index from increasing in value.
Those are just examples. Listings can do whatever they want for whatever reason.
Therefore, the index is not connected to the real market. It is rather pushed around by a number that has no money behind it, making it easy to manipulate and unrepresentative of the real market (to be fair, you can see the general direction).
Because of this, there is not a single serious index for crypto or stocks that is built like this.
Nevertheless, many CS2 market analyses are based on an index that is. All of the serious indexes for crypto and stocks are market-cap weighted (or some price weighted).
Working on market-cap weighted indices that fix all of this, which is why I went down this rabbit hole in the first place.
Follow if you want to see them.
Every CS2 market cap you've ever looked at is wrong.
Structurally wrong.
It’s about the data source: CSFloat.
Here’s why:
When CSFloat finds a new item via inventory crawl or their extension, they generate a unique identifier from float, pattern, and other skin attributes.
That item gets added to their database and it never gets removed.
Doesn't matter if it's used in a tradeup, moved to a storage unit, or moved to a private inventory.
(See screenshot)
This creates two structural problems for market cap analysis:
1. Massive overestimation for skins that are frequently traded up. Every input still counts as "existing supply" even after it's been consumed.
2. Items without a float (cases, agents, patches, music kits, etc.) aren't tracked at all. CSFloat's identification method literally can't see them.
With the October 2025 Trade-Up update, point #1 got worse.
For point #2, there were estimation methods for some untracked items. Those are no longer reliable (Due to the October 2025 Trade-Up update).
On top of all this: we don't even know what percentage of total inventories CSFloat's scans actually cover.
Any market cap built on this data is an estimate with unknown error bars.
The CSFloat database is excellent for what it was built for, finding #1 floats, rare patterns, specific item lookups.
That's not the criticism.
The criticism is using it as a foundation for market cap analysis, where its structural blind spots have become critical flaws.
I've been building an alternative based on random inventory sampling. The first concrete output, a case market cap that doesn't rely on CSFloat data, drops soon. More on the methodology in a follow-up post.
Through manual scanning, the highest ID I found was 76561199895319777. This means the range covers at least 1.9 billion account IDs (not every ID is an account).
Anyone know a reliable way to get the highest currently existing Steam ID?
I thought creating a new account would do it, but the new account doesn’t necessarily get the highest ID.
Need this for a representative sample for market cap analysis
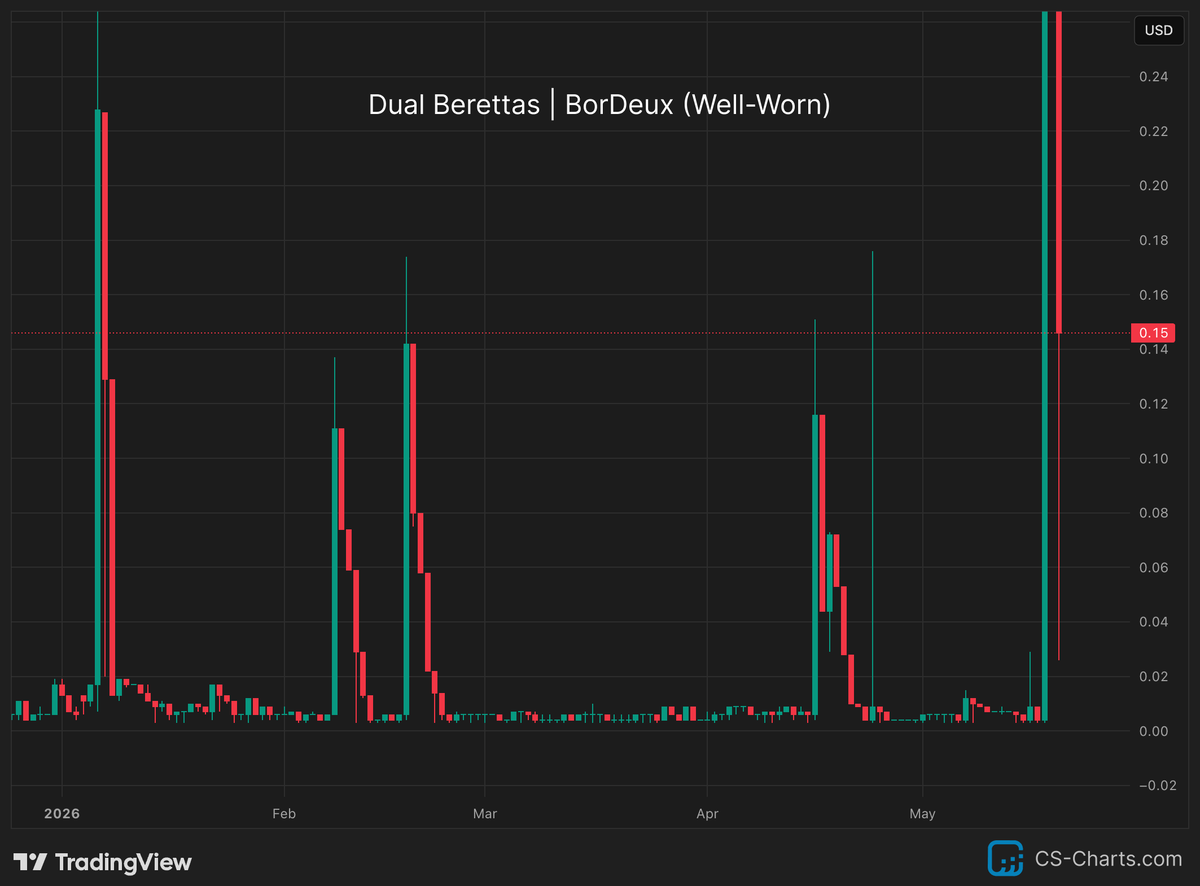
There was a >1h window across multiple marketplaces to grab Souvenirs before pricing caught up.
Chart: Souvenir MP5-SD | Lab Rats (Factory New) on market.csgo
+244% in a few hours.
Sleep is expensive 💸
The Souvenir Trade-Up update was a perfect example of market lag.
For ~50 min after release, skin prices barely moved. Then the EsportFire 300 jumped +1% as Souvenirs climbed. A few hours later, non-Souvenirs dragged the index down 1.5%.
Takeaway: the earlier you're in, the more skins you find that haven't moved yet. The window is hours, not days, but it is there.
Ever wondered how the EsportFire300 is actually weighted?
Took the current Buff prices and put together the top 15 items (out of 300).
They account for 38.7% of the total index value.
Shoutout to @esportfirecom for the index itself 🔥
@cs2speculator@esportfirecom Yeah, true. That's why I built a market-cap weighted index. Top 20 cases by market cap (covering ~95% of the total case market cap), rebalanced every week.
Still early days, but you can take a look here:
https://t.co/mIHuoggJCf
(Full breakdown of methodology etc. coming soon)
@cs2speculator Don't need one 😄
All items are public on: https://t.co/6OAqXBohTq
I just calculate the index myself from the data. Cleared it with EsportFire beforehand of course.
Small change on the EsportFire 300 Index: BUFF163 refresh goes from 5min → 10min.
Reason: Buff's API only serves sticker prices on the 10-min endpoint.
At 5min I get everything except stickers, and rate limits don't let me hit both.
Since the index is sticker-heavy, coverage beats resolution.
If you'd rather have 5min ticks without stickers, let me know (this applies to default sticker charts too).
@esportfirecom