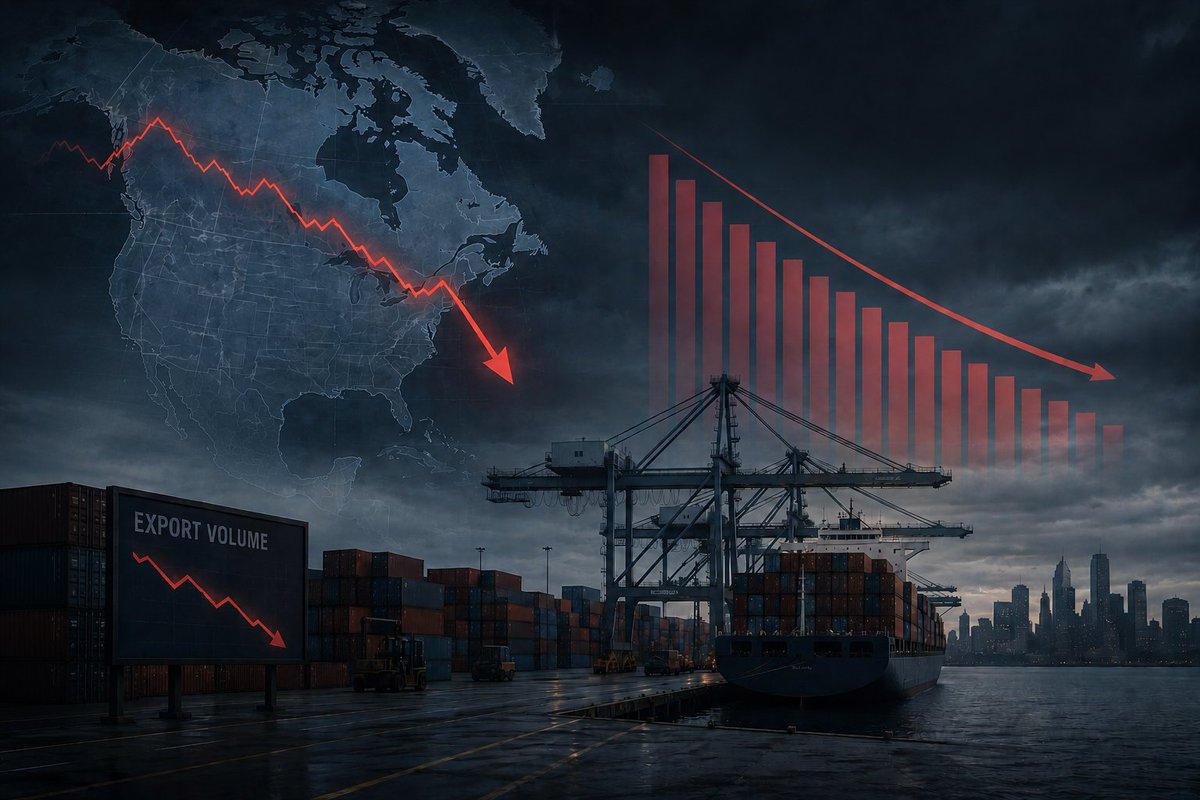
📉 North America #exports recorded YoY decline of 2026 in March, down -3.5%.
Key driver:
🌍 ISCME-bound cargo fell 15%+ YoY
📉 Middle East dropped 60%+
📈 Indian Subcontinent grew +8%, offering partial support
Weakness in key markets continues to outweigh resilient pockets🚢📊
West Africa #exports are surging — but PI up 📈📉
📦 West Coast #Africa exports to ISCME up 55%+
🚢 More vessel calls boosting SSA export activity
But…
💥 SSA → ISCME #price indices fell 18%+ in March vs Feb 2026
Why?
➡️ #Capacity expansion
➡️ Carriers filling return legs
📊 #Global price #indices rose modestly in March, up +5 points to 79...
🚨 Far East → ISCME index #surged +52% MoM following early reactions to the Gulf Crisis.
💡 #Price indices can act as early indicators of #capacity disruption and changing network #dynamics.
Almost time — CTS is heading to Hamburg for #TOCEurope & #CSCLive2026.
Don’t miss our CEO speaking on 19 May in the #Trade & Supply Chain session.
📊 Real market insights
🤝 Industry connections
📍 Meet the CTS team
Last meeting slots remaining — drop us a message to secure time.
North America was the only #region with falling #imports in Feb 2026. 📉
📦 YTD #volumes down 8%+
📈 Canada & Mexico up 5%+ MoM
📉 But all US sub-regions fell 6%+, offsetting gains
A clear #divergence within the region. 🚢📊
CTS will be in Hamburg for #CSCLive2026 this May.
We’re looking forward to connecting and sharing how #data supports smarter decisions across the container #supply chain.
🧭 Track #trade lanes
💰 Understand #pricing
🔍 Uncover #trends
📩 Book a meeting with the team at the show
Sub-Saharan #Africa remains a standout #performer in 2026. 🌍
📦 Fastest-growing Far East #import#region since Apr 2025
📈 +40%+ YTD #growth as of Feb
📉 But saw the largest MoM price drop in Feb (-11%)
Strong #volumes, but #pricing under pressure. 🚢📊
Europe’s #import–#export#imbalance continues to widen.
📉 Feb 2026 data shows Europe exports down -3.4% YTD
🌍 All regions saw reduced imports from Europe
📦 Biggest driver: Far East #volumes down 5%+ YTD
A #trend worth watching in the months ahead. 🚢📊
#Global volumes hit 15.04M TEUs in Feb 2026, up +11.7% YoY — an unusually strong month. 📈
📉 Global #Price Index at 74
(-4 MoM, -10 YoY)
🚀 Standout: Far East → Indian Sub-Continent & Middle East saw a +30%+ MoM index surge
Strong #volumes, but mixed pricing signals. 🚢📊
Our CEO Nigel Pusey will be speaking at #CSCLive2026 this May on “Trade & Supply Chain” session on 19 May:
🌏 #Trade trends shaping 2026
⚖️ #Market imbalances & pricing
🚢 What the #data reveals about #supply chains
📍 Hamburg Messe
📅 19–21 May
Don’t miss it.
Exciting news — CTS will be at the Container Shipping Conference at #TOCEurope in Hamburg this May!
Join the conversation shaping global container supply chains.
📍 Hamburg Messe
📅 19–21 May 2026
If you’re attending, let’s connect 🤝
#CSCLive2026#ContainerShipping#Maritime
Far East imports from South & Central America reversed sharply in early 2026.
📉 Down 25%+ vs Dec 2025
🌏 Greater China -30% MoM
📦 SE Asia & North Asia both -17%+
🌏Japan -20%, linked to lower volumes via Busan & Tokyo 🚢📊
#ContainerShippingData#Import#Export#Insights
🌙 Eid Mubarak from us at CTS
As we celebrate the joyous occasion of Eid al-Fitr, we extend our warmest wishes to our clients, partners, and friends around the world.
Selamat Hari Raya Aidilfitri
#EidMubarak#HariRaya
#Global#Price#Index held steady at 77 in Jan 2026 — but remains 18% below early-2025 levels. 📊
📉 Largest drop: Far East → South & Central America
📈 Biggest rise: Sub-Saharan Africa → Australasia & Oceania
Mixed #pricing signals across #trades. 🚢
Europe’s #import–export gap continues to widen.
📉 Jan 2026 exports down ~19% MoM and 8% YoY
🌍 ISC & Middle East imports from Europe fell 25%+ MoM
📊 European #exports now declining for 3 straight months
A clear #shift in #trade flows. 🚢
Far East #export strength and Sub-Saharan Africa #growth are continuing into 2026.
📦 SSA imports from the Far East up ~7% vs Dec 2025
🚀 +85% YoY in January
Claire Thackeray will explore these African cargo #trends at The 2026 Pivot conference in South Africa. 🚢📊
Be sure to check out the first #release of our January 2026 #data!
See how the year has started ahead of the various market disruptions currently unfolding.
Read our press release below, or head to our website to explore the #figures for yourself. 🚢📊
https://t.co/fp6Bu8G9b5
Europe → Far East was the weakest major #trade in 2025.
📉 Volumes down ~6% YTD
🌍 Northern Europe & W. Med/N. Africa both -5%
💰 Price index ended 2025 down 23.5% vs 2024
More insights on this lane at #TPM26 in tomorrow’s Asia–Europe #outlook panel. 🚢📊
South & Central America has been a key beneficiary of Far East #export#growth in 2025.
📦 #Imports to the region up 10% overall
📈 Far East → South America up 15%
🌎 Growth led by West Coast SA, then East Coast
Asia–South America #trade lanes continue to #strengthen. 🚢
Sub-Saharan Africa imports surged nearly +20% in 2025. 📈
Around half of that growth came from Far East cargo, underlining the impact of rerouted Asia–Africa trade on regional volumes. 🚢
#ContainerShipping#GlobalTrade#Maritime#Freight#ShippingData