#BTC
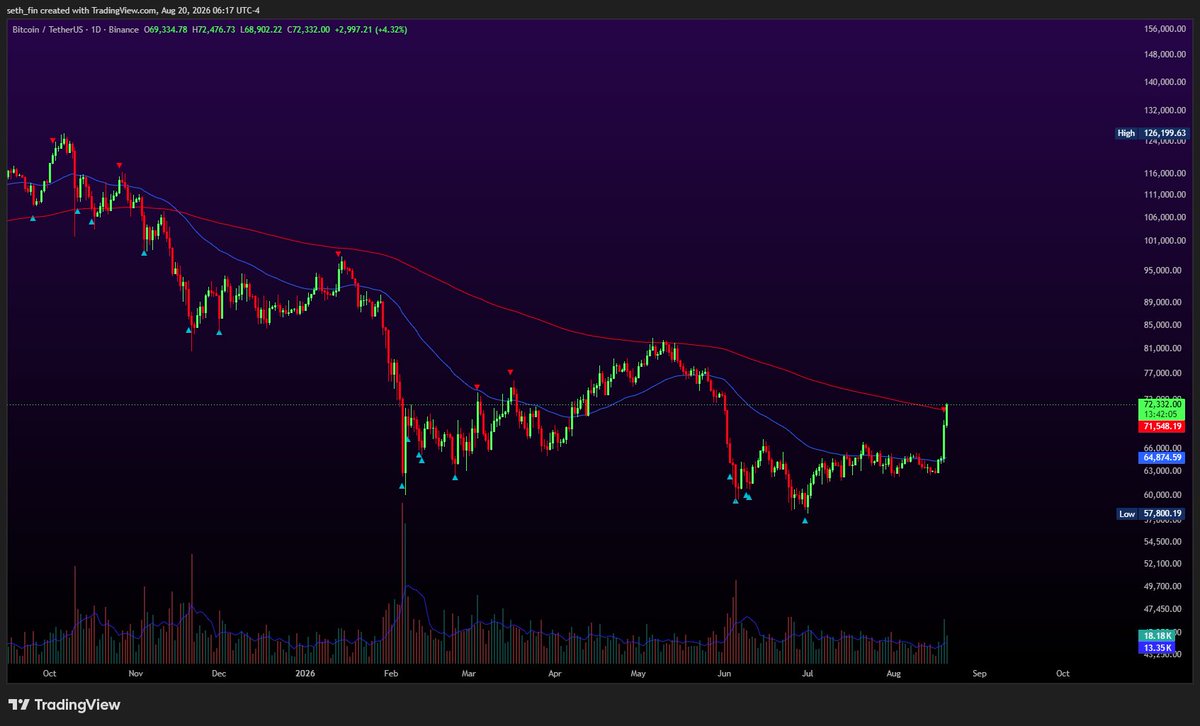
Bitcoin has had macro price action clusters develop throughout the entire Bear Cycle, with fake-breakouts
If you believe the bottom is in, that's absolutely fine
But in that case, Bitcoin will need to sustain itself at these highs to confirm that that bias is worth holding
And the reality is that Bitcoin technically, as per 4 Year Cycle tendencies, could have the time until the 31st of December 2026 to perform a Bear Market low
That's a lot of time
And if this is a Bear Market Relief Rally then time will likely verify this move, because strength isn't sustainable in Bear Cycles
$BTC #Bitcoin
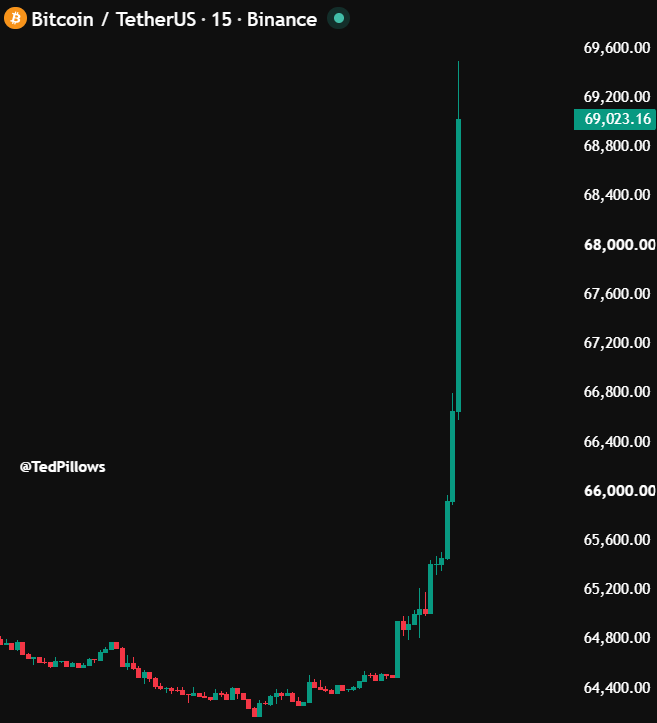
🚨 HERE’S WHAT ACTUALLY CAUSED BITCOIN TO EXPLODE TO $69,700.
Everyone is looking at the Bitcoin candle.
But the move started in a completely different market:
U.S. Treasury bonds.
The Treasury just DOUBLED the size of its long-term bond buyback program.
→ Old maximum: $2 BILLION per operation
→ New maximum: AT LEAST $4 BILLION
→ Targets: 10-to-20 and 20-to-30-year Treasury bonds
→ Starts September 9 through November 4
In simple words:
The Treasury is offering more support to the market for long-term U.S. government debt.
And that matters because Treasury yields are basically the return investors can get from holding government bonds.
When those yields FALL, risky assets like Bitcoin usually become more attractive.
And look what happened right after the announcement:
→ 10-year yield: -6 bps to 4.647%
→ 30-year yield: -9 bps to 5.196%
Then Bitcoin moved.
$65,400 at 10:45 AM ET
→ $67,600 at 11:26 AM ET
→ $69,700 at 11:27 AM ET
Bitcoin gained more than $2,000 in ONE MINUTE.
That move trapped traders betting against Bitcoin.
As their leveraged shorts were liquidated, they were forced out of their positions, creating even more buying.
The result:
💀 $1.59 BILLION in crypto liquidations over 24 hours
💀 $746 MILLION in Bitcoin shorts reportedly wiped out in that one-minute candle
So the chain reaction was simple:
TREASURY EXPANDS BOND BUYBACKS
↓
LONG-TERM YIELDS FALL
↓
BITCOIN PUMPS
↓
SHORTS GET LIQUIDATED
↓
FORCED BUYING SENDS BTC EVEN HIGHER
One important correction:
⚠️ This is NOT QE.
⚠️ The Fed did NOT turn on the money printer.
Treasury is buying back existing government bonds to improve liquidity in that market.
And the size is still small compared with how much debt the U.S. issues.
But the timing matters.
The bond market moved FIRST.
Bitcoin followed.
Then the short squeeze turned it into an explosion.
Everyone is showing you the green candle.
Almost nobody is talking about what happened right before it.
September 9 is now the date to watch.
$BTC 72k-73k is for shorting.
The HTF picture is starting to look pretty bullish but this POI is legit for shorts and can give good RR setups.
Only a little move can already offer a 2-3R setup.
Waiting for some PA to develop in this poi.
$ETH This massive daily candle to end the consolidation at this exact same price region is giving me the same vibes as last year.
Obviously it is just a comparison and unlikely for the price action to be the same afterwards but it was still worth pointing out for the sake of it since it was so similar.
You don't often see such big daily candles. But since I already saw many people rushing to short, the last time this happened, the next 2 days added another +20% on top.
$BTC is approaching the 73.3K VAH of the previous HTF range we broke back into.
This is a very important level, and could give a high RR short setup with a clear invalidation.
If Bitcoin rejects the VAH, I'm 100% executing shorts after the trigger to catch a potential pullback.
I'm approaching this as a swing trade, so a LTF entry could give tremendous RR.
If price reclaims the VAH and finds value above 74.3k resistance, the short thesis is invalidated and looking for continuation longs is in-play.
Time to pay attention here.
🚨 BITCOIN RSI JUST HIT ITS HIGHEST LEVEL SINCE THE OCTOBER 6 TOP.
Daily RSI has exploded above 70 and is now sitting around 78, putting Bitcoin back into the same momentum region seen around previous major local tops.
If Bitcoin can hold this strength and RSI remains elevated, bulls could finally take full control of the trend.
But if this rally starts losing momentum, history gives us a clear warning.
The last few times RSI reached this region, Bitcoin rolled over and moved significantly lower.
This is a huge test for bulls.
$BTC
Once again we needed this sweep breakout
We've been closing in same level in SMA200 for weeks and now we took mFVG and the only target left is compression lower
Real capitulation is coming
I've discussed $SUI yesterday.
Classic liquidity sweep on many #Altcoins today on the markets.
This results into a high volume candle due to the fact that a lot of stops are here.
The ideal entry zone, and that's why I think that entering here could be ideal. A reversal is likely going to take it all the way towards $0.75.