Things may start to look a little different around here—Cyfe is now part of Traject.
What does this mean for me?
✅ New brand design
✅ Discounted access to other tools in the Traject suite
✅ The features you love, with improvements coming soon
https://t.co/tWjn6wH975
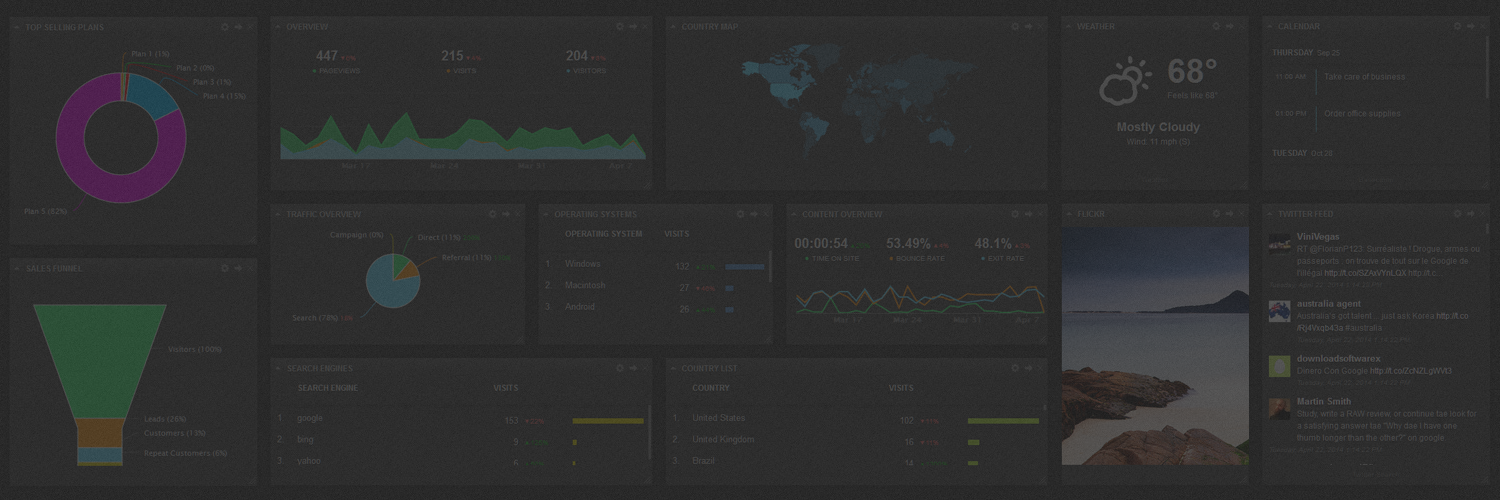
Build a social media dashboard that will:
📈Pull data from any social channel with one-click integrations
📈Offer visual representation of real-time KPIs
📈Provides easy-to-interpret metrics for high-level overviews of your goals
https://t.co/6OAJRQkyfy
Everything you need to know about data dashboards, including different dashboard types, how to design it, which data sources makes sense, and how it differs from a report. https://t.co/rEmbhou8hU
Marketers invest a lot in lead gen campaigns, andlanding pages are where these leads can either disappear or flourish into highly-qualified conversions. Use these KPIs to optimize their performance👇 https://t.co/0vo5hebq5t
Adding Zapier integrations opens up a whole new world of data sources you can pipe into your dashboards.
Here's how to set it up and a guide on the 9 most popular Zaps to use in Cyfe. https://t.co/m7jAQPYkG5
Everything you need to know about data dashboards, including different dashboard types, how to design it, which data sources makes sense, and how it differs from a report. https://t.co/rEmbhotAsm
Are you tracking these?
1. Backlinks
2. User Sentiment
3. Content Downloads
4. Active Email Subscribers
5. Average Time on Page
6. On-Site Behavior
https://t.co/of3AofMPtr
Wondering what people are saying about Cyfe? Hint: it's pretty good things. Cyfe recently made the @g2 Top 20 most popular data visualization software based on verified ratings from users. Check out the report: https://t.co/aejcMTYjXN
Small businesses have certain KPIs that will help them find opportunities for improvement and growth that differ from larger businesses—use this list to begin tracking them. https://t.co/IOivPkqXFF
Conversion rate not what you want it to be? The contact form is an underutilized piece of real estate on your site that can boost this KPI. Here's how to make the most out of yours: https://t.co/eExErMeVif
These 10 guidelines will make sure you maximize the impact of your data tracking:
1. Set a clear goal
2. Prioritize data visualization
3. Don't ignore issues outside the scope of data
4. Automate data entry to reduce human error
5. Analyze a large enough s https://t.co/rkb6XYazEX
#DashboardingTip: Create a competitor dashboard.
Monitor your competitor’s content, social media growth, keyword rankings, traffic ranking, reach, and even page views per user. Learn how to set it up here: https://t.co/PFiYhUz2cX
#DashboardingTip: Determine the purpose of your dashboard: Operational, Strategic, Marketing, Financial, and Competitor (Hint: a high-growth business will have all 5!)
Not all metrics are created equal, and not all are KPIs.
Here's how to hone in on the most useful data and which KPIs to choose across each main business function.
https://t.co/GlFbtYe4sz
10 tips to help you figure out what to report on, how you should report it, and how you can create a data dashboard that’s easy to understand for everyone: #Data#BI#DataAnalytics https://t.co/Zj4Ayrd3Nd
Being able to monitor, track, and share your efforts on a web analytics dashboard can help elevate your business, client relationships, or internal company standing. Cut through the noise of options and prioritize these top data sources👇
https://t.co/ffi0Iq7RHq
Whether it's finding open restaurants that offer takeout or helping people who have lost their income find local jobs, information is critical. Use this guide to find your own way you can source goodwill using a dashboard: https://t.co/P8JBytmn7x
It's not easy keeping your team on the same page and on top of tasks—here's a few tricks you can try and collaborative tools you can use: https://t.co/mHrYIqaszJ