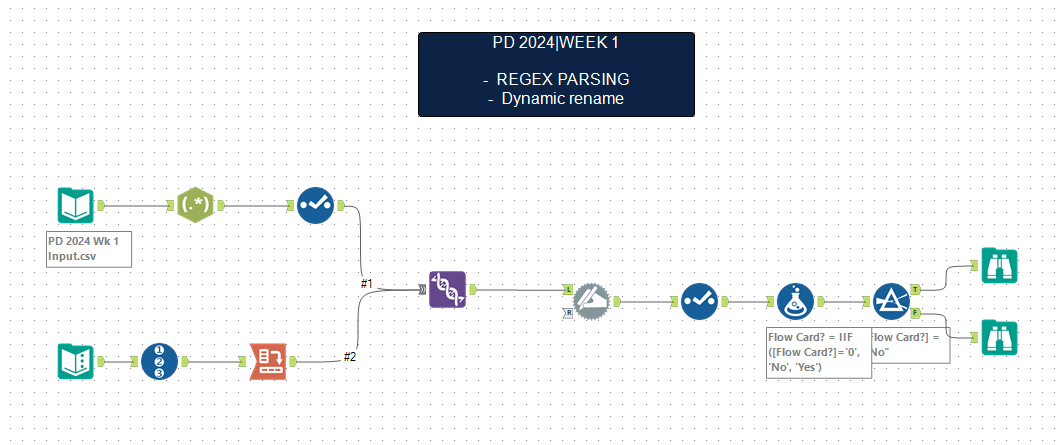
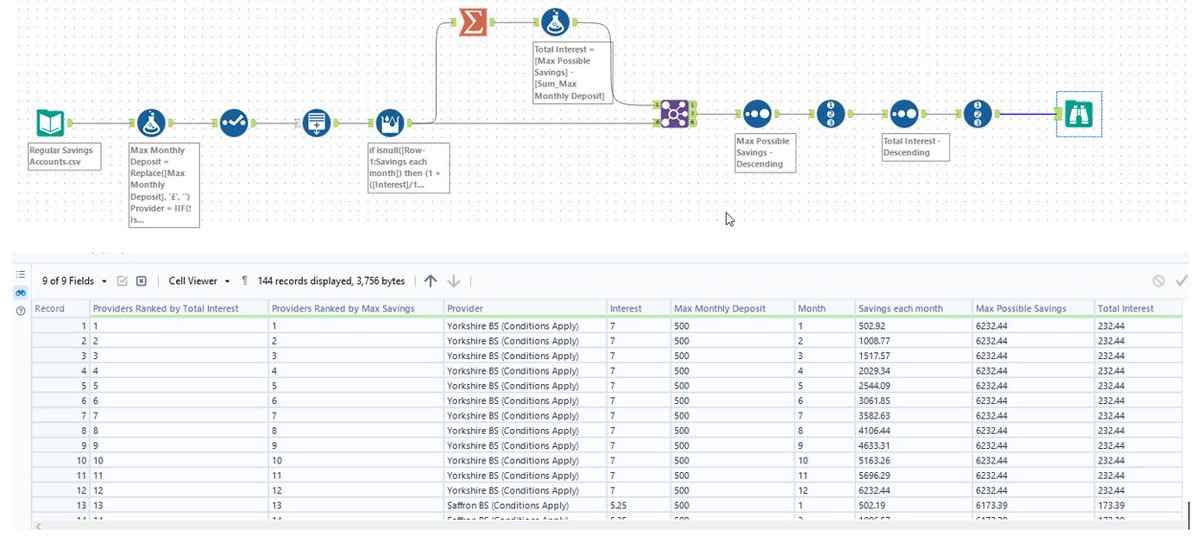
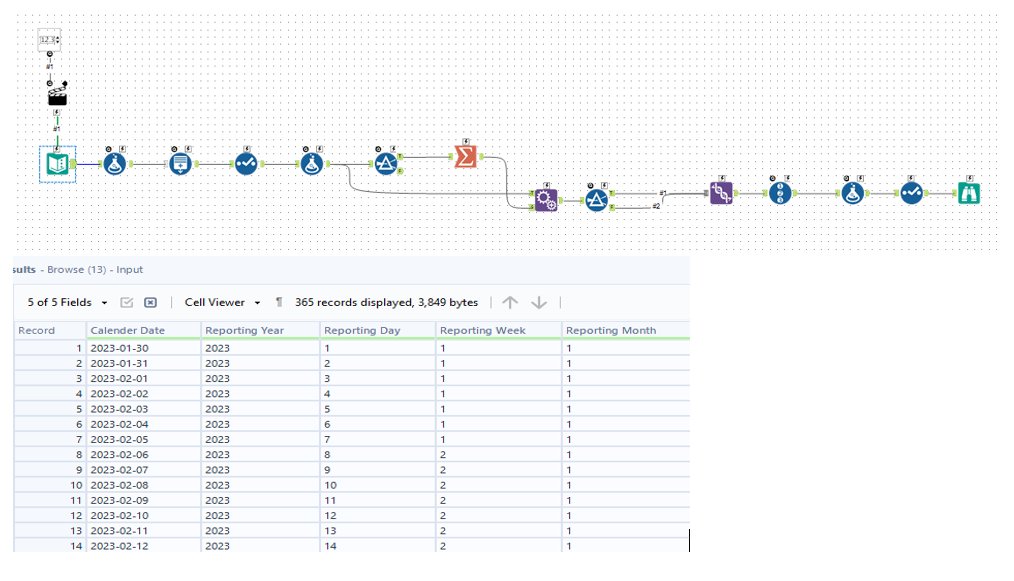
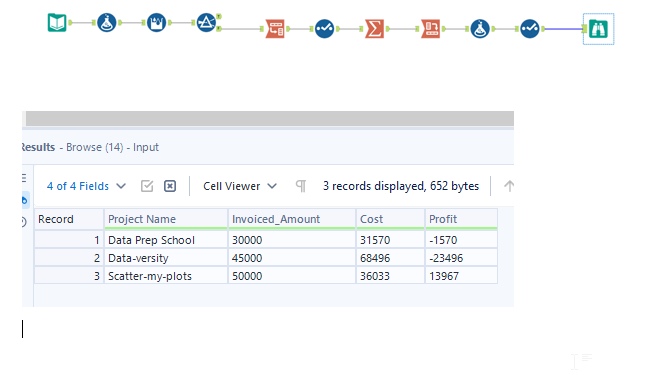
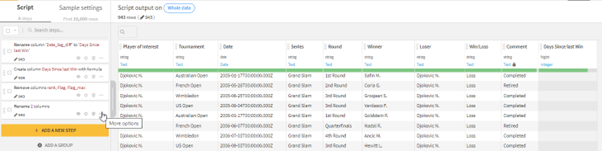
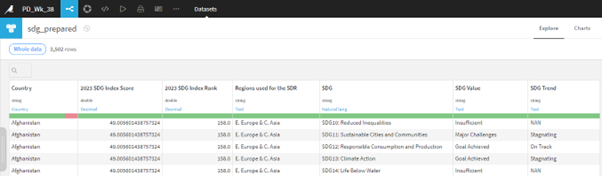
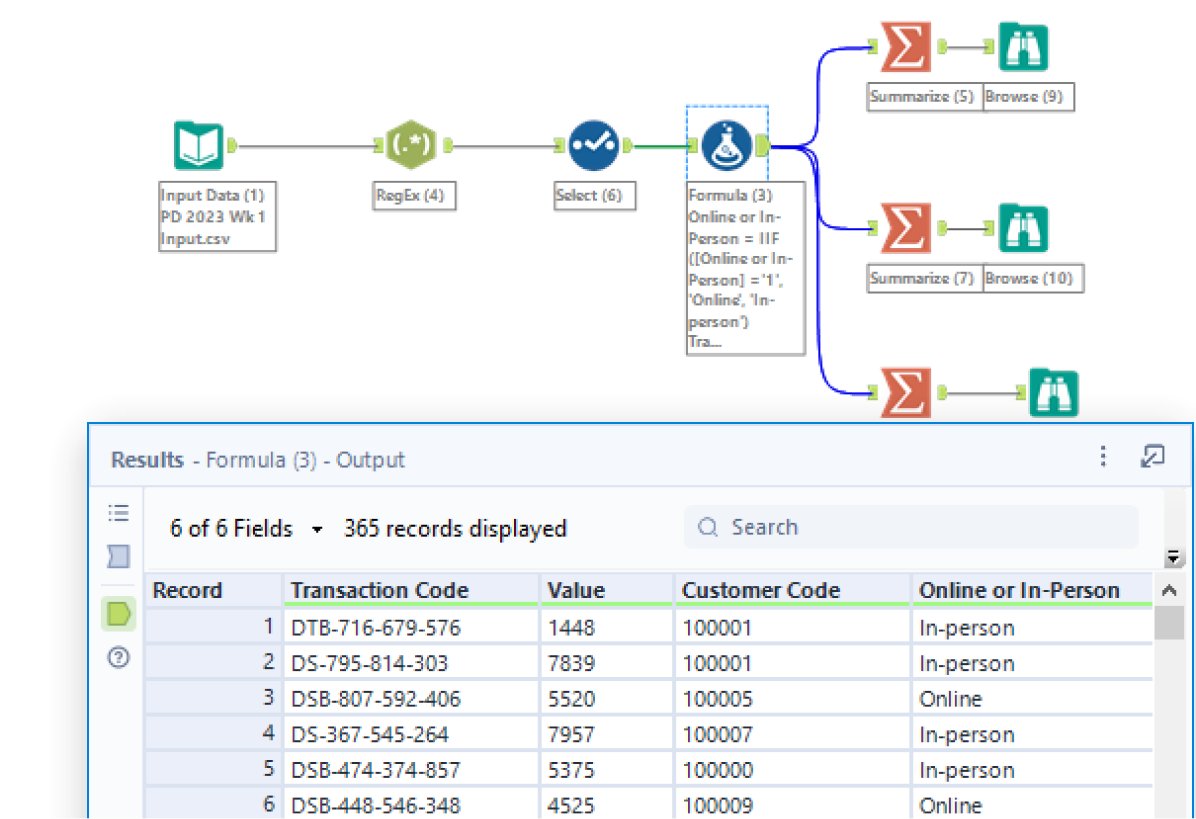
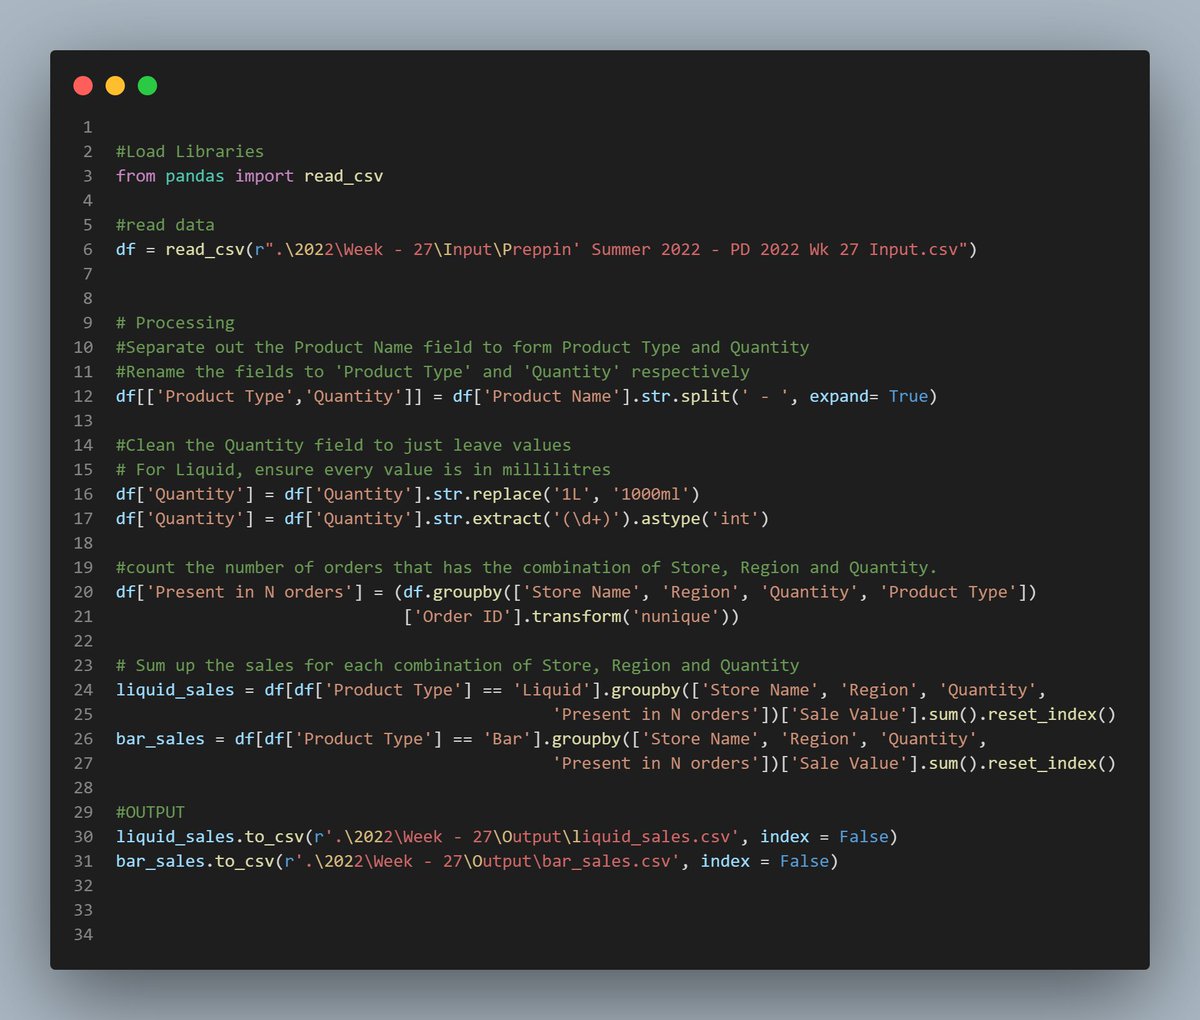
#preppindata week 38 in #alteryx This was a tough one, used a function I rarely use charfromint() to replace initials mapping file. The output row count stumped me a little. Believe there are extract rows in the solution dataset.
#makeovermonday Week34
Use of social media among different demographics:
In this viz I have used a small multiple chart with dynamic sorting based on the platform selected.
@DatavizChimdi@VizWithIrene
Viz what you love!❤️
Qualifiers for the ultimate data viz competition—#IronViz—is now open. Enter by visualizing data on a topic that makes your heart full.
Submit your Iron Viz entry by October 31! Win or learn, you can't lose. https://t.co/YNngEJHEei
Learn how to build 75 Charts in 75 minutes in @Tableau. This is a great resource for anyone looking to expand their skills and increase the library of charts they know how to create.
https://t.co/O3Xpvwqdcg
Survey says? Explore how @d_kungu visualizes survey data about flight operations in this #VOTD which showcases bar charts and gantt charts. https://t.co/qrdJOgAIMP