Ukraine’s fight is our fight, their cause is our cause, and their independence will be our victory.
To the Ukrainian communities in Canada and around the world celebrating their culture, identity, and traditions this Vyshyvanka Day: Canada stands with you.
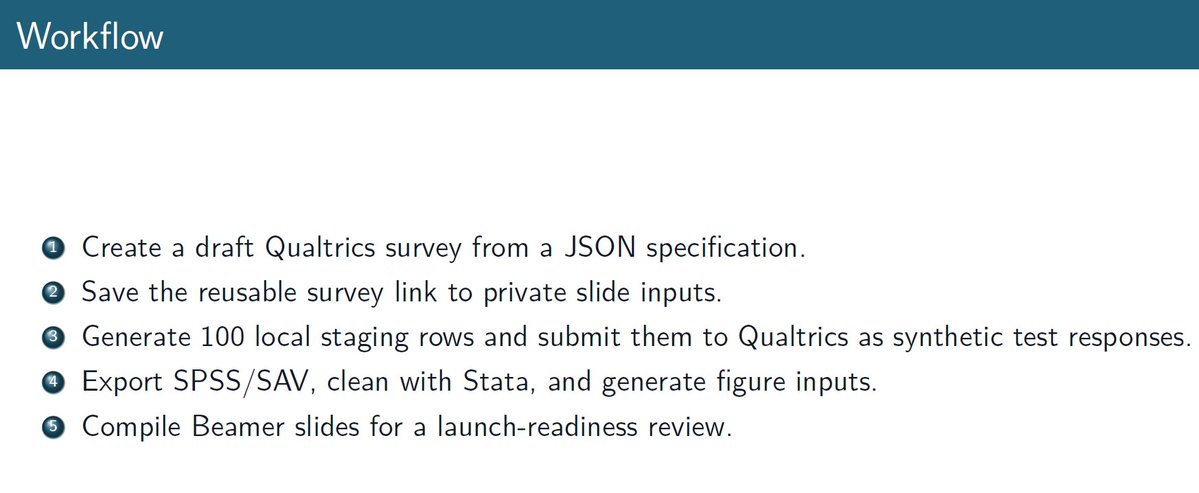
Do you run Qualtrics surveys? Then use my GitHub repo to automate the whole process with Codex! Tell Codex what you want to study, and it will create the survey, push to the survey to Qualtrics and generate synthetic responses, download and clean the data, and produce a set of slides summarizing the process.🧵with complete guided example!
Technical change often simplifies the tasks performed by labor. This raises productivity. But it can also erode the bargaining power of workers.
My new paper “The Commoditization of Labor” (with Fukui and Nakamura) is about this.
Some thoughts. (Link below) 1/
The UAE exploring a swap line with the US should give us pause that the consequences of the Iran conflict are far greater than what we see priced in markets. Such explorations do not arise lightly, even behind closed doors.
12 years ago Luigi @zingales and I wrote the first draft of our paper “Diagnosing the Italian Disease”, which linked the stalling of Italian productivity to its firms’ failure to effectively use ICT.
Unfortunately, it seems it remains very much relevant today in the age of AI 🙁
#econtwitter #ai
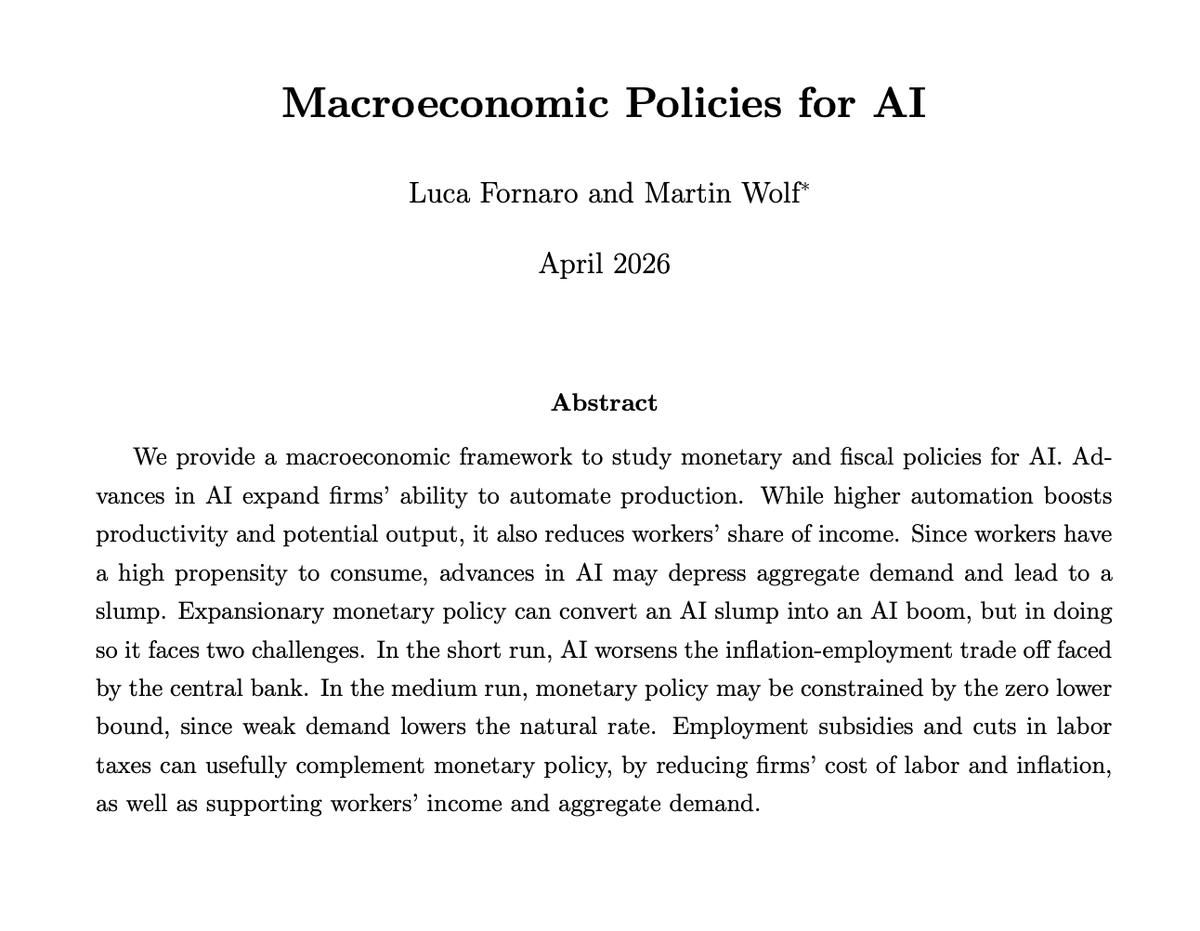
How will AI affect our economies? In this new paper, we argue that macroeconomic policies may determine whether we will face an AI slump or an AI boom. Spoiler: monetary policy alone may have a hard time sustaining an AI boom, employment subsidies/cuts in labor taxes can help.
Core PCE inflation has been running about 1 percentage point above target. Many estimates say this can be explained by tariffs. In a note published tonight, @tradewartracker and I argue this is inconsistent with the pattern of inflation seen in core goods. 🧵 (1/9):
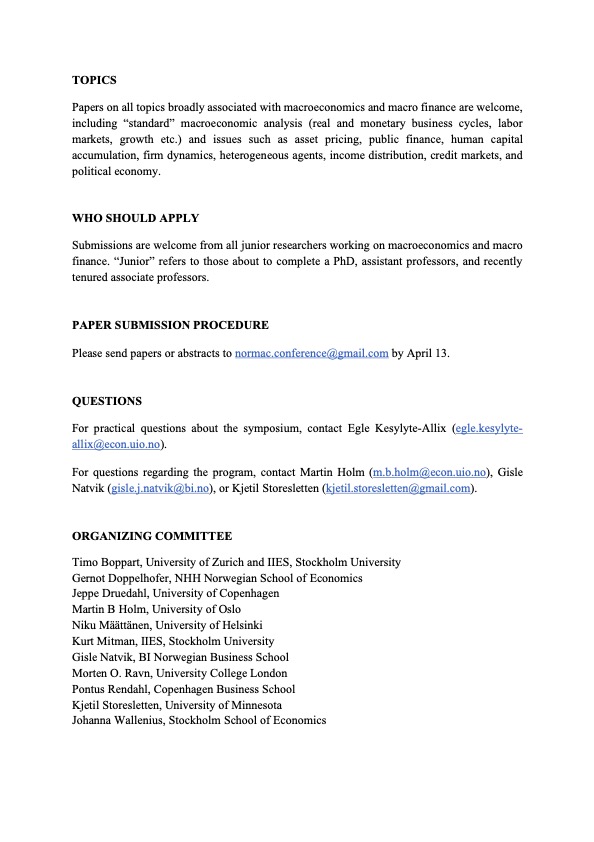
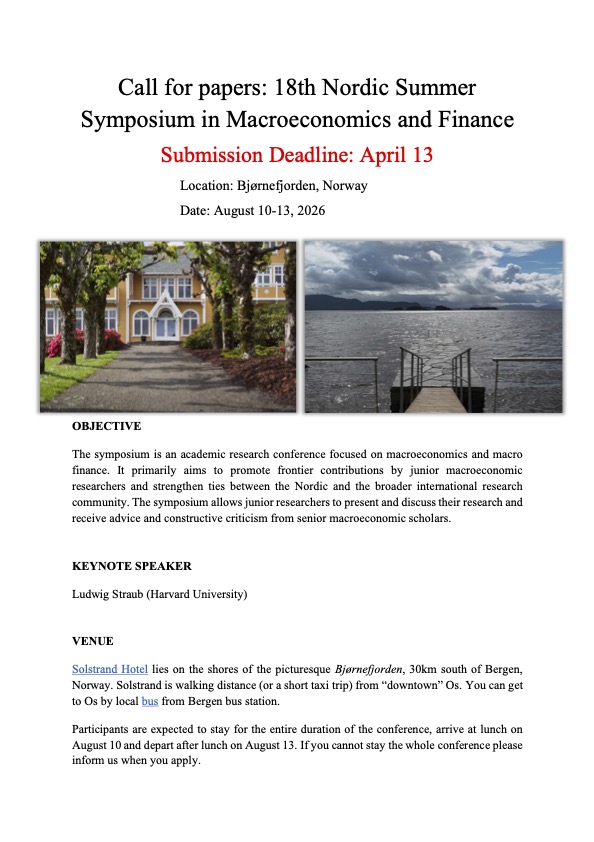
My favourite macro conference of the year just announced its call for papers! It's mainly intended for "juniors" (=PhD students, Assistant and recently Associate profs). Tight deadline, so apply before April 13.
RT if you think someone else might be interested.
Is the Phillips curve useful to make sense of inflation?
A.W.H. Phillips first postulated a negative empirical correlation between inflation and the level of economic activity. Looking at inflation in 2021-24---up and down---versus measures of unemployment---roughly unchanged---shows little correlation. Has the Phillips curve failed, yet again? No, it did not.
Friedman and Phelps, almost 50 years ago, clarified that this correlation should only hold keeping expected inflation fixed. Almost every account of how firms choose prices or bargain wages with their workers predicts that expectations would show up in a Philips curve. Moreover, those models of behavior further add that increases in marginal costs (supply shocks) would further shift out this relation. The empirical Phillips curve has for many decades meant a negative relation between inflation and real activity, controlling for expected inflation and supply shocks.
The left figure below shows on the vertical axis inflation, after controlling for expected inflation---mean and disagreement from a household survey---and for supply shocks---gas prices and global supply pressures. The horizontal axis shows a measure of slack in the labor market---the log of the ratio of unemployment to job vacancies. The Phillips curve held nicely and steadily throughout.
A criticism of that figure is that its is looking in the rear view mirror: the measure of supply shocks and the measure of slack were developed in the last few years and the data has been revised. The right figure does instead an out-of sample exercise. Estimate a regression of inflation on (i) expected inflation, (ii) the difference between the unemployment rate and the CBO estimate of its non-cyclical component, and (iii) the PCE energy price index. Do it on data pre-pandemic: 1984Q1-2020Q1. Using that estimated equation, predict inflation in real time from then onwards using the data releases available at the time of the forecast. The Phillips curve was a pretty good predictor of inflation throughout.
The Phillips curve was stable during the inflation surge, and it predicted well the movements in inflation, with expectations playing a key role in those predictions.
Notes: it is important to include the right measure of expectations to understand inflation-activity dynamics at a business-cycle frequency: the short-horizon expectations of households and firms. (For instance, the long-horizon expectations from professionals, or the expectations from models in policy institutions, as in my previous two posts, are the wrong measure.)
Sources:
(i) Section 3 in Reis "Why Did Inflation Rise and Fall in 2021-24? Channels and Evidence from Expectations"
(ii) The simple exercise on the left figure is inspired on the analysis of Bernanke and Blanchard “What Caused the US Pandemic-Era Inflation?”
(iii) The simple exercise on the right figure is inspired on @jadhazell "Comment" in the NBER macro annual 2025, which in turn built on Beaudry, Hou, and Portier "The Dominant Role of Expectations and Broad-Based Supply Shocks in Driving Inflation"
My op-ed in the @FT on the US net international investment position (NIIP) which is the trigger for Section 122 to deal with trade deficits. https://t.co/SwBr8KyoWT
after nearly four years of relentless war, ukraine continues not to target russian civilian casualties.
russia continues to target ukrainian casualties day after day after day.
we should not forget this.
Submissions are now open for SED 2026 which will be held July 2-4, in Athens, Greece.
We are excited to announce plenary speakers George-Marios Angeletos, @virgiliu79, and @poweill.
Submit your papers here: https://t.co/MQxwXG4Cyf
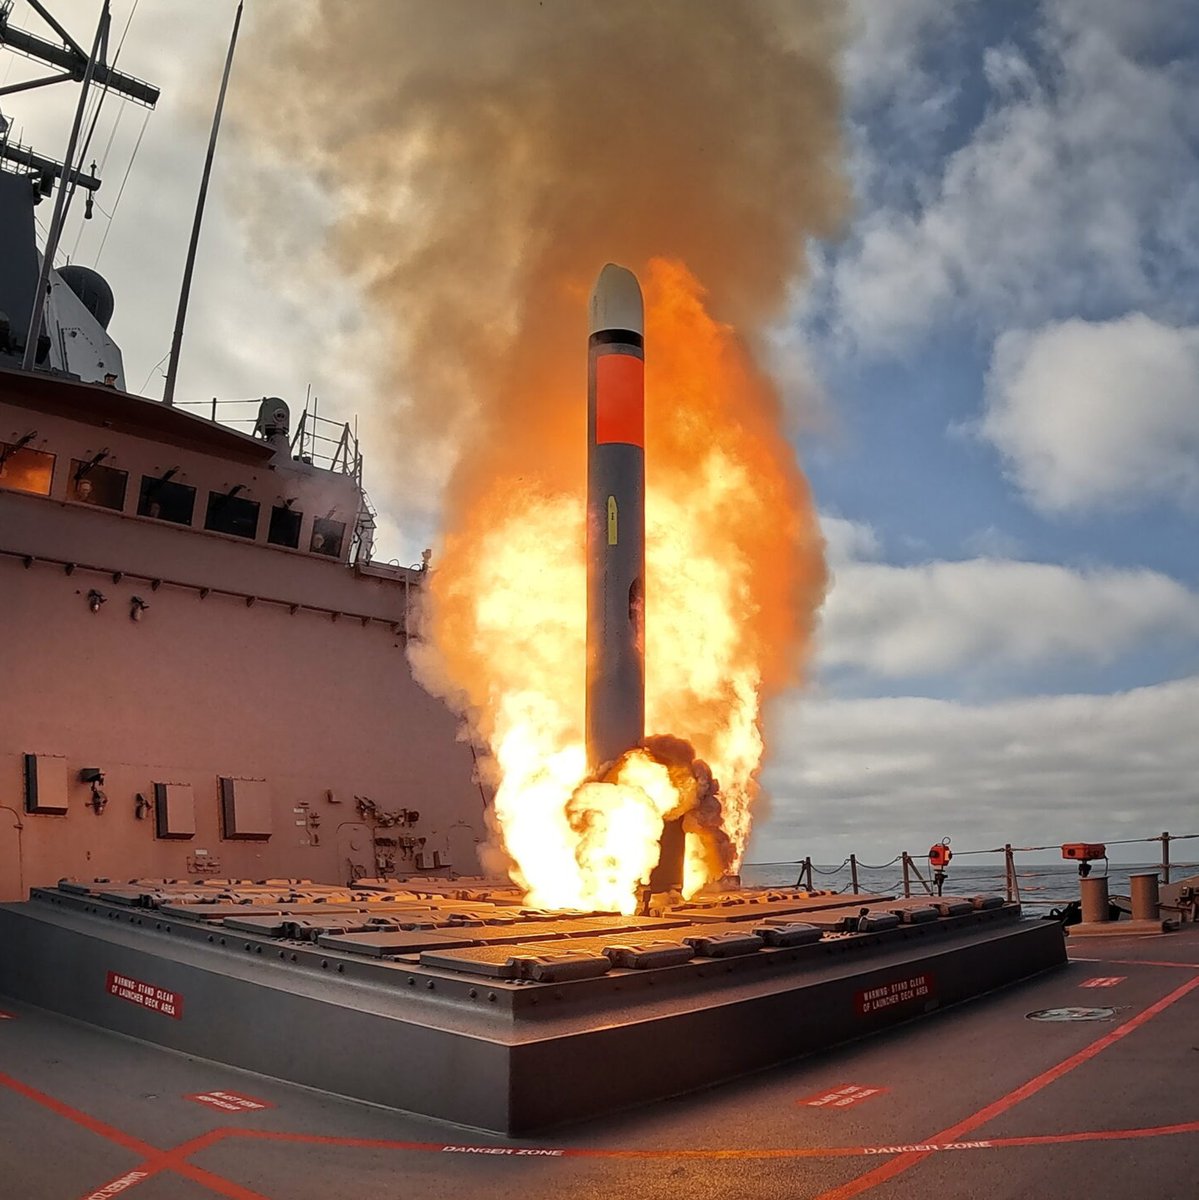
Putin fears Tomahawks. Proven in battles, they threaten Russia’s S-400s and can shift the war’s course.
If Trump wants peace, he must give Ukraine Tomahawks.
They pierce Russian air defenses and hit any target, recently proving effective against Iran — The Telegraph. 1/