Bauxite, the principal raw material used to produce alumina and ultimately aluminium, has become an increasingly important dry bulk commodity. The resulting metal is widely used in construction, transport, packaging and electrical equipment.
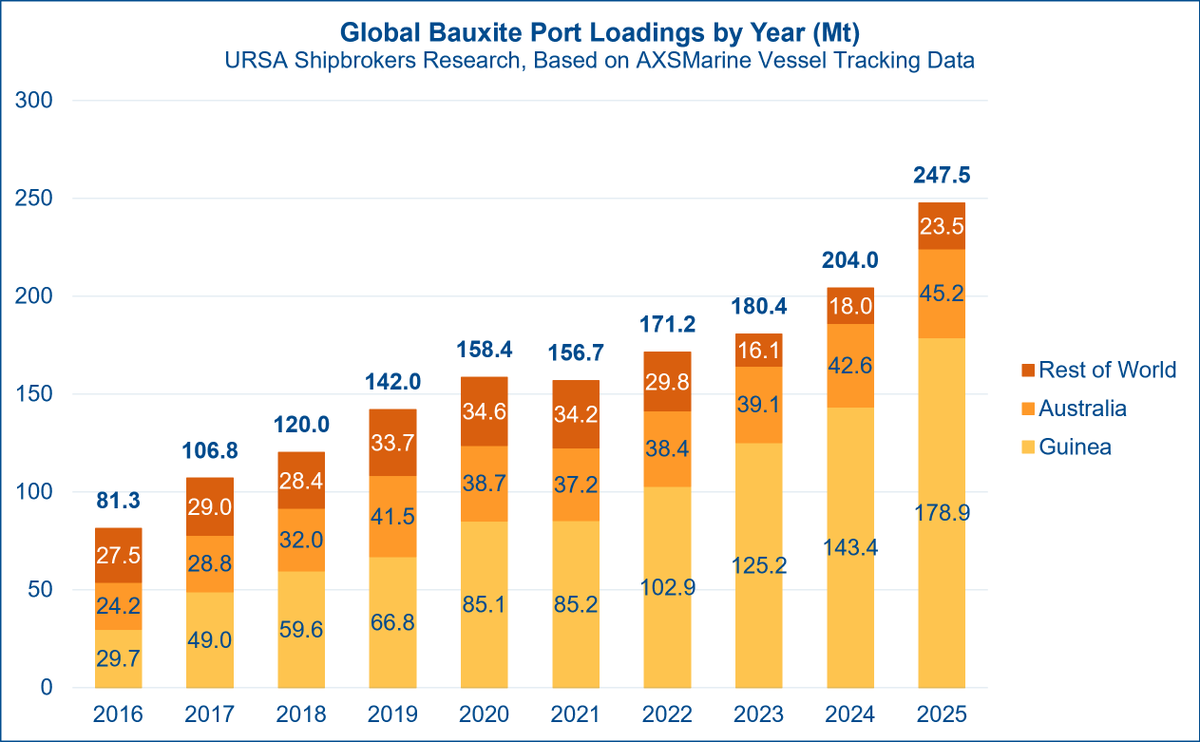
Global ocean bulk bauxite trade more than tripled between 2016 and 2025, rising from 81.3 Mt to a record 247.5 Mt. This represented an increase of 166.2 Mt, or 204.4%, and a compound annual growth rate of 13.2%.
Growth remained firm during the first seven months of 2026. Global bauxite port loadings reached a record 160.5 Mt between January and July, up by 13.9 Mt, or 9.5%, year on year. Volumes increased in six of the seven months, with July loadings rising by 20.9% to 22.8 Mt. Including limited early August quantities, loadings reached 163.1 Mt during 2026 to date.
The longer-term expansion considerably outpaced the wider dry bulk trade, which grew by 25.0%, or 2.5% annually, between 2016 and 2025. Against 3,402 Mt of global dry bulk port loadings during 2026 to date, bauxite accounted for 4.8% of the total, compared with 1.8% in 2016 and 4.3% in 2025.
China was at the centre of this expansion. China-bound bauxite loadings increased from 52.7 Mt in 2016 to 218.7 Mt in 2025, while their share of global trade rose from 64.7% to 88.4%. The 166.1 Mt increase in China-bound volumes accounted for virtually all the net growth in global bauxite trade over the period. During 2026 to date, 149.8 Mt of bauxite loadings were destined for China, lifting their share of the total to 91.9%.
On the supply side, Guinea was overwhelmingly responsible for the expansion. Its bauxite loadings rose by 149.2 Mt between 2016 and 2025, accounting for almost 90% of the net growth in global trade. Guinea supplied 129.5 Mt during 2026 to date, equivalent to 79.4% of global bauxite loadings, compared with 21.8 Mt from Australia and 11.7 Mt from the rest of the world.
Historical vessel tracking data from 2013, when coverage first became available, to the present show that vessel employment within the bauxite trade has been concentrated among larger bulk carriers. Capesize vessels accounted for 27.7% of cumulative bauxite cargo intake, followed by Newcastlemax vessels at 18.3% and Post-Panamax vessels at 16.2%. Together, these three classes represented 62.2% of cumulative bauxite cargo intake. Panamax and Supramax vessels followed with shares of 11.7% and 7.4%, respectively, while Kamsarmax vessels, named after the Guinean bauxite port of Kamsar, accounted for 7.2%.
During the first seven months of 2026, AXSMarine vessel tracking data suggest that around 2.6% of global dry bulk cargo loadings for international trade were routed, or are expected to be routed, through the Suez Canal.
The figures exclude cabotage and cover all dry bulk cargoes, origin and destination combinations, and bulk carriers of every size and age.
For context, Suez accounted for annual shares of 2.8% in 2025 and 2.9% in 2024, while the 2026 YTD share remains substantially below the 6.5% recorded in 2023, its highest share since 2015, before the Red Sea disruption took full effect.
Despite the recent recovery in vessel transits, with the January to July 2026 total rising by 21% year on year even amid the ongoing Iran war, Suez has yet to regain its previous importance within global dry bulk trade.
Conversely, an estimated 18.2% of global dry bulk cargo loadings were routed, or are expected to be routed, via the Cape of Good Hope during the first seven months of 2026.
Although below the full year high of 19.9% recorded in 2025, the highest annual share since 2015, the share remained considerably above the annual 14.8% recorded in 2023, before the Red Sea crisis materially altered vessel routing.
Dry bulk cargo routing via the Cape increased sharply during 2024 and remained elevated through 2025 and the first seven months of 2026 as more vessels avoided the Red Sea and Suez Canal.
Although the increased share of cargo routed via the Cape cannot be attributed entirely to Suez diversions, the broader shift since 2023 has lengthened sailing distances and supported tonne mile demand and vessel employment.
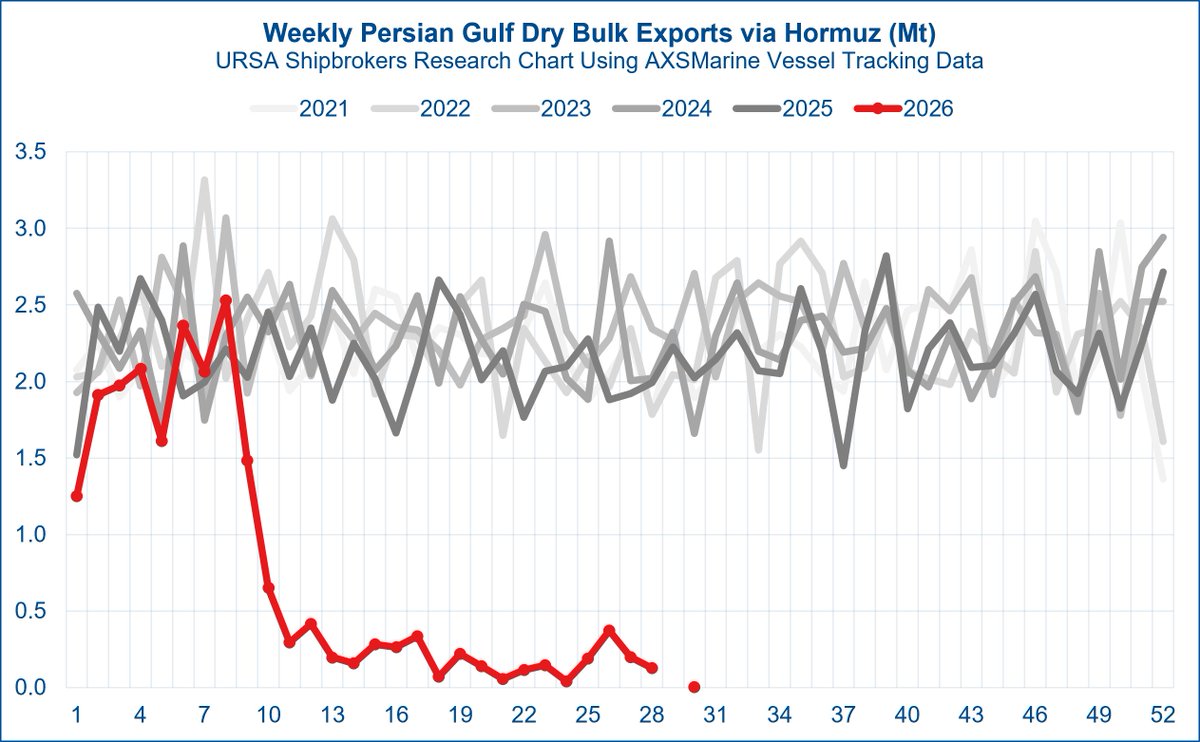
Hostilities in the Iran war began on 28 February 2026, during week 9, which ran from 23 February to 1 March.
Dry bulk carrier vessel tracking data from AXSMarine suggest that cumulative ocean bulk cargo exports from Persian Gulf ports west of the Strait of Hormuz, destined for discharge outside the region, amounted to approximately 5.8 million metric tonnes across all cargo types during weeks 9 to 30 of 2026. This 22 week period begins with the week in which hostilities broke out and ends with the latest week for which data are available.
The data should, however, be treated with caution. Ongoing hostilities have reportedly resulted in GPS jamming, AIS spoofing and vessels going dark, potentially limiting the completeness and accuracy of vessel tracking data.
During the corresponding 22 week period in 2025, vessel tracking data indicate 46.3 Mt of ocean bulk cargo exports from the Persian Gulf.
This means that exports from the region during the period under review were approximately 40.5 Mt lower than during the corresponding period last year, representing a decline of 87.5% year on year.
The shortfall is particularly relevant for dry bulk trades, as the Persian Gulf is an important source of limestone, aggregates, fertilisers and fertiliser raw materials, including urea and sulphur.
Tracked dry bulk exports through the Strait of Hormuz briefly rebounded from an exceptionally low base during weeks 25 and 26 of 2026, covering 15 to 28 June. Weekly volumes increased to 0.2 Mt and 0.4 Mt respectively, although their combined total remained approximately 86% below the sum of the corresponding decadal weekly averages.
The timing of this modest rebound coincided with a short lived easing of restrictions following the preliminary US Iran ceasefire agreement and the temporary reopening of the Strait of Hormuz. This appears to have allowed a limited number of delayed cargoes to leave the Persian Gulf before renewed maritime attacks and military escalation once again constrained commercial traffic.
Tracked export volumes subsequently fell back to negligible levels. However, given the continuing disruption to vessel tracking systems, it remains difficult to distinguish between an actual absence of cargo movements and movements that could not be reliably observed.
According to vessel tracking data from AXSMarine, capturing the voyage footprint of dry bulk carriers, global coal port loadings reached an estimated 119.1 million metric tonnes during June 2026, the latest fully completed calendar month for which data are available.
The data cover coal cargoes of all varieties, including steam or thermal coal used for power generation, which accounts for roughly 75% of the ocean bulk coal trade annually, and metallurgical or coking coal used in steelmaking.
Global seaborne coal loadings increased by 3.5% month on month, or 4.1 Mt, from 115.0 Mt in May 2026. Growth was even stronger year on year, with volumes rising by 12.2%, or 13.0 Mt, from 106.1 Mt in June 2025.
June therefore marked the third consecutive month in which global seaborne coal loadings recorded simultaneous month on month and year on year increases. This sequence began in April 2026, following the outbreak of the Iran war in late February and the unprecedented curtailment of oil and gas exports originating from within the Persian Gulf, west of the Strait of Hormuz.
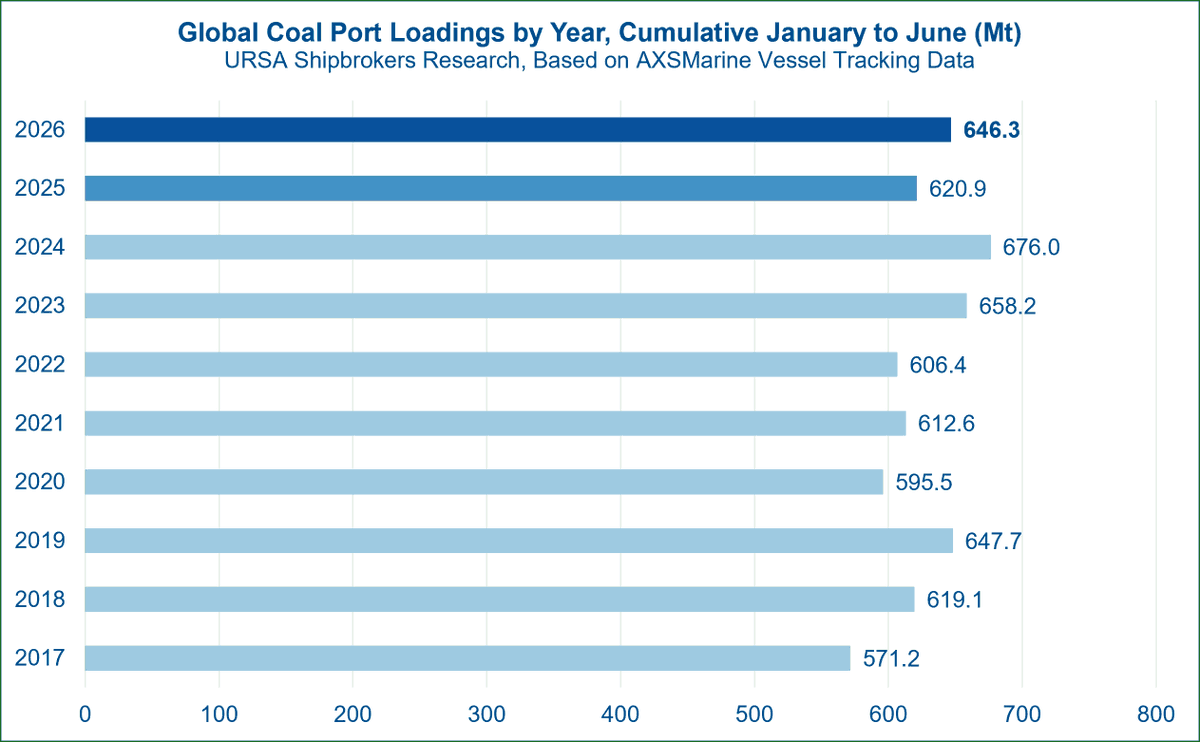
According to vessel tracking data, the strength recorded in recent months lifted cumulative global seaborne coal loadings to 646.3 Mt during the first half of 2026. This was 25.4 Mt, or 4.1%, higher year on year than the 620.9 Mt loaded during the corresponding period of 2025.
The recovery was supported by stronger coal import requirements across several major economies, particularly Japan and South Korea, where electricity generation remains notably exposed to natural gas availability and prices.
EU Corn Imports Rise As Output Falls
According to the latest data from the United States Department of Agriculture (USDA), corn consumption across the 27 member states of the European Union (EU) is estimated at 74 Mt during the ongoing 2025/26 Marketing Year (MY), spanning October 2025 to September 2026. This is down from 77 Mt in the previous 2024/25 MY.
The softer consumption outlook coincides with a continued contraction in the bloc's swine sector, an important source of feed demand. USDA data indicate that EU swine production is expected to decline to 228 million head in calendar year 2026, from 230 million in 2025, while total slaughter is projected to fall from 229 million to 225 million head. Ending inventories are also forecast to decrease to 124.2 million head, from 127 million a year earlier.
Meanwhile, EU corn production is estimated at 56.8 Mt in 2025/26, down 2.79 Mt, or 4.7%, from 59.59 Mt in 2024/25. Looking ahead to the 2026/27 MY, spanning October 2026 to September 2027, consumption is forecast to edge higher to 74.4 Mt, while production is projected to decline further to 53.78 Mt. This would widen the gap between consumption and domestic output to 20.62 Mt, from 17.2 Mt in the ongoing MY.
Consequently, the EU's corn self sufficiency is estimated to fall from 77.4% in 2024/25 to 76.8% in 2025/26, before declining more sharply to 72.3% in 2026/27.
Corn imports are estimated at 18.5 Mt in the ongoing MY, down marginally by 0.26 Mt, or 1.4%, from 18.76 Mt in 2024/25. However, imports are forecast to rise by 4 Mt, or 21.6%, to 22.5 Mt in 2026/27. This would mark the highest volume since 2022/23, as falling domestic production increases the need for external supplies despite only a marginal recovery in consumption.
Beyond the baseline forecast, there may be some upside for EU ocean bulk corn imports during 2026/27. Renewed attacks on Ukrainian port infrastructure and increased caution among shipowners have reduced Black Sea grain export capacity and created uncertainty around Ukraine's ability to supply the bloc [1][2].
Should these constraints persist, a greater share of EU requirements could be sourced from more distant origins such as the United States and Brazil. Brazil's main safrinha crop is harvested largely between June and September, while fresh US supplies become available during the autumn harvest. Both seasonal windows broadly coincide with the opening months of the new EU MY and could support longer haul seaborne volumes into the bloc.
References:
[1] Pavel Polityuk, "Ukraine's Black Sea Ports Lose a Third of Grain Export Capacity Farmers' Union Says", Reuters, 15 July 2026.
[2] Anna Pruchnicka and Yuliia Dysa, "Shipowners Halt Calls at Ukraine's Black Sea Ports Wary of Russian Strikes", Reuters, 23 July 2026.
China Iron Ore Imports Mark Strongest June
According to data from the General Administration of Customs of the People's Republic of China (GACC), the country's iron ore imports reached 112.69 million metric tonnes in June 2026, the most recent month for which data are available.
Iron ore is the primary raw material used in blast furnace steelmaking and represents the dry bulk market's largest commodity trade by volume, with China accounting for an estimated 75% of global seaborne iron ore imports.[1]
Chinese iron ore imports in June 2026 recorded a 15.3% month on month increase, equivalent to 14.98 Mt, from 97.71 Mt in May. Volumes were also 6.5%, or 6.90 Mt, higher year on year compared with 105.79 Mt in June 2025.
The June increase marked a return to year on year growth following the brief interruption recorded in May 2026, when imports declined by 0.2%. This followed eleven consecutive months of year on year increases from June 2025 to April 2026 and remains supportive of vessel employment, particularly for the larger dry bulk vessels typically deployed in the trade, namely Capesizes.
At 112.69 Mt, Chinese iron ore imports in June 2026 were the highest recorded for any June during the current decade.
Strong First Half Performance
June's strength, together with robust import volumes earlier in the year, brought cumulative Chinese iron ore imports during 1H 2026 to 628.87 Mt. This was 37.48 Mt, or 6.3%, higher year on year compared with 591.39 Mt during 1H 2025 and marked the strongest first half of the current decade.
Steel Output Remains Weaker
The strength in iron ore imports appears, at first glance, to contrast with weaker crude steel production. According to the National Bureau of Statistics of China, the country produced 499.95 Mt of crude steel during 1H 2026, down 14.88 Mt, or 2.9%, year on year from 514.83 Mt during 1H 2025. Nevertheless, June output reached 83.67 Mt, representing a modest increase of 0.48 Mt, or 0.6%, compared with June 2025.
Domestic Iron Ore Output Declines
Part of this apparent divergence may be explained by the sharper decline in China's domestic crude iron ore production. Output fell to 466.86 Mt during 1H 2026, down 41.74 Mt, or 8.2%, year on year. The contraction was particularly pronounced in June, when production declined by 18.59 Mt, or 20.9%, year on year to 70.37 Mt.
It should be noted, however, that China's crude iron ore production is reported on a gross run of mine basis and is therefore not directly comparable tonne for tonne with generally higher grade imported iron ore.
References
[1] Clyde Russell, "China's Steel Sector Looks Weaker Than It Is, Reverse for Iron Ore", Reuters, 21 July 2026.
Hardly Immaterial
What caught our eye this week? In its latest release, the IMF projects global growth of 3.0% in 2026, down from 3.5% in 2025, followed by a rebound to 3.4% in 2027. [1]
For those interested in the relationship between GDP growth and dry bulk cargo demand, or indeed looking for signs of a disconnect, preliminary vessel tracking data from AXSMarine show that global dry bulk port loadings destined for international maritime trade reached 2.876 billion tonnes during the first half of 2026.
This was up from 2.767 billion tonnes in the first half of 2025, representing growth of 3.9%, above the IMF's projected annual global GDP growth rate for 2026.
Perhaps more interestingly, the active trading dry bulk fleet at the end of the first half of 2026 amounted to around 1.071 billion deadweight tonnes of cargo carrying capacity. This was up 3.3% year on year from 1.037 billion tonnes at the end of the first half of 2025, broadly suggesting that annual incremental supply additions have so far failed to keep pace with the expansion in ocean bulk transportation demand.
According to the IMF, "the modest slowdown [during 2026] reflects the effects of the war in the Middle East being partly offset by accelerated demand-driven momentum in the global technology cycle thanks to advances in artificial intelligence (AI) and its adoption".
But can global economic growth hinge on AI? A particularly interesting partial answer was offered a few weeks earlier by the Energy Institute's latest data release.
Global power demand from data centres reached a fresh annual record of 788 terawatt hours in 2025, broadly comparable with Brazil's electricity consumption. [2]
Meanwhile, global electricity generation rose by 3% year on year to a record 32,202 TWh in 2025, with coal contributing 10,511 TWh, or 32.6% of the total. China remained the world's largest electricity market, generating 10,575 TWh, equal to 32.8% of global output.
As a result, data centres, increasingly driven by artificial intelligence, accounted for 2.4% of global electricity generation in 2025, up from 2.1% in 2024 and 1.5% in 2020.
In fact, global data centre power demand rose by 19.7% year on year to 787.8 TWh, far outpacing growth in overall electricity generation and, indeed, global GDP. The increase of 129.6 TWh was roughly equivalent to adding a power market the size of the Philippines in a single year.
The irony, perhaps, is that the supposedly weightless digital economy is becoming increasingly dependent on very tangible inputs: power plants, transmission grids, construction materials and vast quantities of fuel. It is hardly immaterial.
[1] "World Economic Outlook", IMF, July 2026.
[2] "Statistical Review of World Energy", Energy Institute, 2026.
🇪🇸For the second time this year, Trump has threatened to ax U.S. trade with Spain over Iran-related defense spending.
The U.S.-Spain farm trade deficit has deepened over the last decade despite a 2025 rebound.
Corn was the top U.S. ag export last year at 31% of total value.
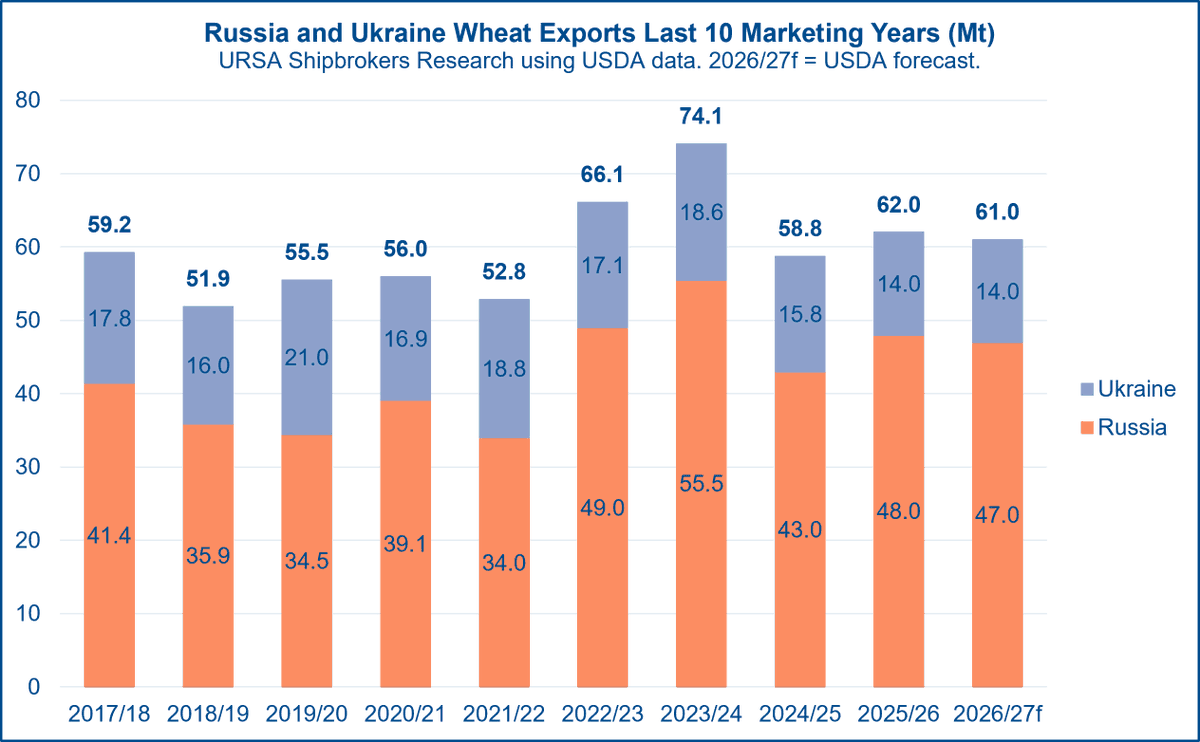
The Black Sea is the world's largest ocean bulk wheat exporting region, anchored by crop output and shipments from Russia and Ukraine.
According to the United States Department of Agriculture (USDA), the Marketing Year (MY) for both Russian and Ukrainian wheat runs from July to June each year. This means that the recently concluded 2025/26 MY ran from July 2025 to June 2026.
During this period, the USDA estimated that Russia and Ukraine exported a combined 62 million tonnes of wheat to the world across all transport modes, including seaborne and overland movements. This comprised 48 Mt from Russia and 14 Mt from Ukraine.
For the 2025/26 MY, combined Russian and Ukrainian wheat exports were therefore up by 3.2 Mt, or 5.5% year on year. However, this aggregated annual increase was attributable to a rebound in Russian export volumes, which rose by 5 Mt, or 11.6% year on year. Ukrainian wheat exports to the world fell by 1.8 Mt, or 11.1%, compared with the 2024/25 MY.
Combined exports nevertheless remained below the recent 2023/24 peak of 74.1 Mt, while Ukrainian exports were still well below their 2019/20 high of 21 Mt, reached before Russia's full scale invasion of Ukraine in February 2022.
Most wheat crops in the producing regions of Russia and Ukraine are traditionally planted between September and October each year, with harvesting taking place in July and August. This typically lends seasonal support to export volumes from the start of Q3.
For the recently started and ongoing 2026/27 MY, which spans July 2026 to June 2027, the USDA forecasts a lower combined Russian and Ukrainian wheat crop of 111.5 Mt. This would be down by 2.9 Mt, or 2.5% year on year, compared with 114.4 Mt during 2025/26.
Russian production is expected to reach 88 Mt in 2026/27, while Ukrainian production is forecast at 23.5 Mt. These figures would be down by 2.3 Mt and 0.6 Mt year on year, respectively.
The USDA also expects lower wheat export volumes from Russia and Ukraine during 2026/27, with the combined total forecast at 61 Mt. This would be down by 1 Mt, or 1.6% year on year. Russian wheat shipments to the world are expected to reach 47 Mt, down by 1 Mt, or 2.1% year on year, while Ukrainian exports are forecast to remain steady at 14 Mt.
Below is a very interesting map from Reuters to bookmark for those interested in tracking Typhoon Bavi as it makes its way towards the East China Sea in the days ahead.
https://t.co/oCW0pfmcsq
Digital infrastructure is becoming an increasingly important driver of electricity demand.
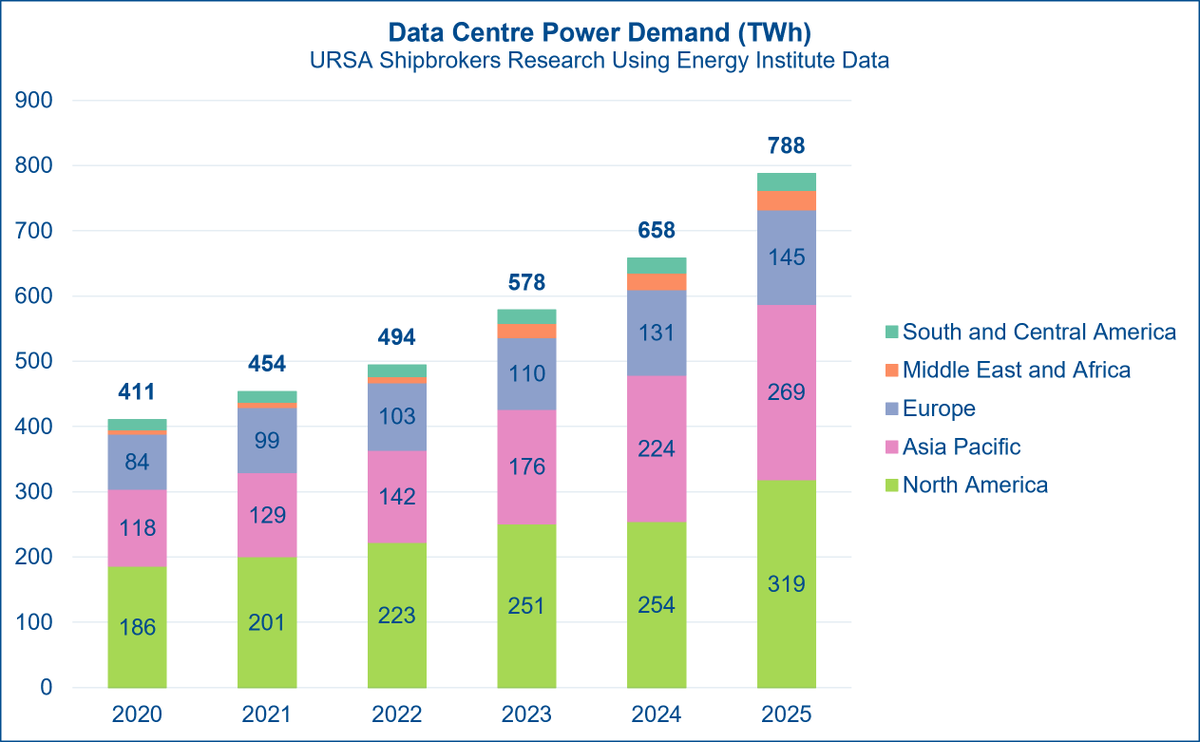
According to the latest data from the Energy Institute, global power demand from data centres reached a fresh annual record of 788 terawatt hours in 2025. This was roughly similar in scale to Brazil's total electricity generation last year, estimated at 764 terawatt hours.
Global electricity generation across all sources rose by 3% year on year in 2025, reaching a historical high of 32,202 terawatt hours. Of this total, coal accounted for 10,511 terawatt hours. China remained the world's largest electricity market, with generation of 10,575 terawatt hours, equal to 32.8% of the global total.
As a result, data centre electricity needs, now increasingly shaped by the rapid expansion of artificial intelligence, accounted for 2.4% of global electricity generation in 2025. That share was up from 2.1% in 2024 and 1.5% in 2020.
The pace of growth was also notable. Global data centre power demand rose by 19.7% year on year from 658 terawatt hours in 2024, far outpacing the growth rate in overall electricity generation. In absolute terms, the increase was 129.6 terawatt hours, roughly equivalent to adding another power market the size of the Philippines during the year.
North America, essentially led by the United States, accounted for 40.5% of global data centre power demand in 2025. Asia Pacific followed with 34.1%, with China representing around three quarters of the regional total.
Likewise, the fastest year on year growth in data centre related electricity demand from 2024 to 2025 was seen in North America at 25.3% and Asia Pacific at 19.9%, with the United States up by 25.5% and China up by 20.3%, as the two global powers remain firmly engaged in the artificial intelligence infrastructure race.
June 2026 concluded earlier this week, and with it the first half of 2026.
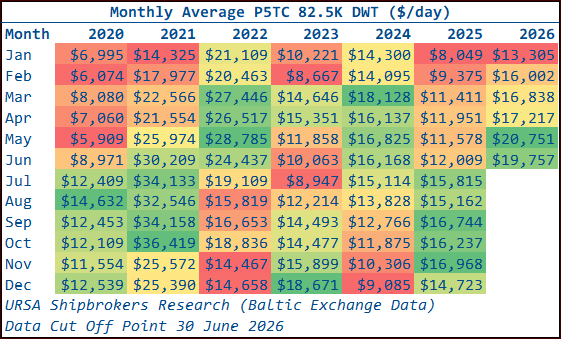
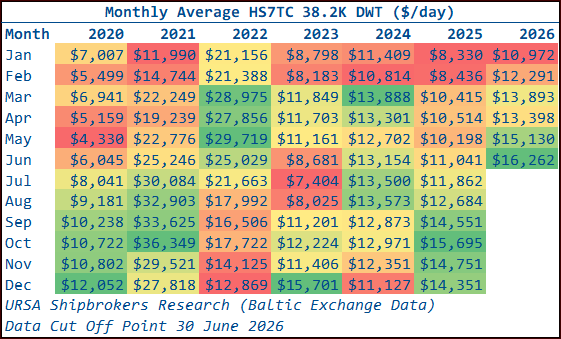
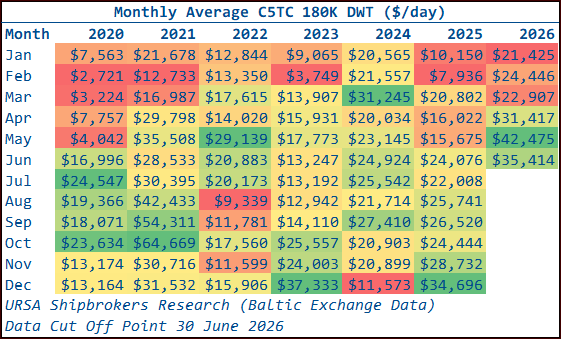
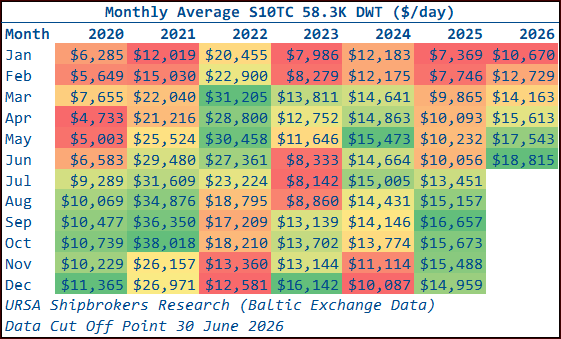
The following four heatmap matrices show the monthly averages of the @BalticExchange dry bulk weighted time charter averages in $/day, by month and year, from January 2020 to June 2026.
For Capesizes and Supramaxes, we use the older and smaller benchmark vessels, 180K DWT and 58.3K DWT respectively, to preserve uninterrupted continuity across the 2020s.
A recurring theme across the dry bulk index averages in 2026 has been a strengthening towards the most recent months. The June 2026 monthly averages were the second strongest year to date for the Capesize ($35,414) and Panamax ($19,757) indices, and the strongest year to date for the Supramax ($18,815) and Handysize ($16,262) indices.
For Capesizes, the June 2026 average was also the strongest June reading of the current decade. For Panamax, Supramax and Handysize, June was the third strongest June of the 2020s, behind the pandemic influenced strength of June 2021 and June 2022.
Those earlier peaks were shaped by unusually high port turnaround times, as pandemic related health management protocols kept vessels away from the market for longer and artificially restricted supply. At the same time, spillover containerised cargoes into the smaller dry bulk sizes helped create a bottom up pattern of market strength.
However, this year's resilience and strength through the end of June appear to be more fundamental in nature, particularly given the notable trade policy and geopolitical uncertainty seen during the period.
Broadly, on an annual incremental basis, and with incremental growth arguably one of the elements needed to move markets forward, the existing trading active deadweight cargo carrying capacity of the global dry bulk fleet expanded from 1.037 billion tonnes at the end of 1H 2025 to 1.070 billion tonnes by the end of 1H 2026. This represented net growth of 3.2%.
Yet preliminary vessel tracking data from @AXSMarine suggest that global dry bulk port loadings destined for international cross border maritime trade, excluding cabotage, may have reached 2.886 billion tonnesbetween January and June 2026. This was up 4.3% year on year from the aggregate 1H 2025 volume of 2.767 billion tonnes, managing to surpass deadweight growth. The data remain preliminary, as figures of this scale adjust and settle over time as they are revisited, but they are still interesting and useful as an early indication.
Reinforcing the sense that deadweight capacity growth is still trying to catch up with overall dry bulk shipping demand, preliminary AXSMarine data also suggest that, on top of observed cargo growth, global dry bulk tonne miles expanded by 6.6% year on year during 1H 2026. This points to an even stronger expansion compared with deadweight growth.
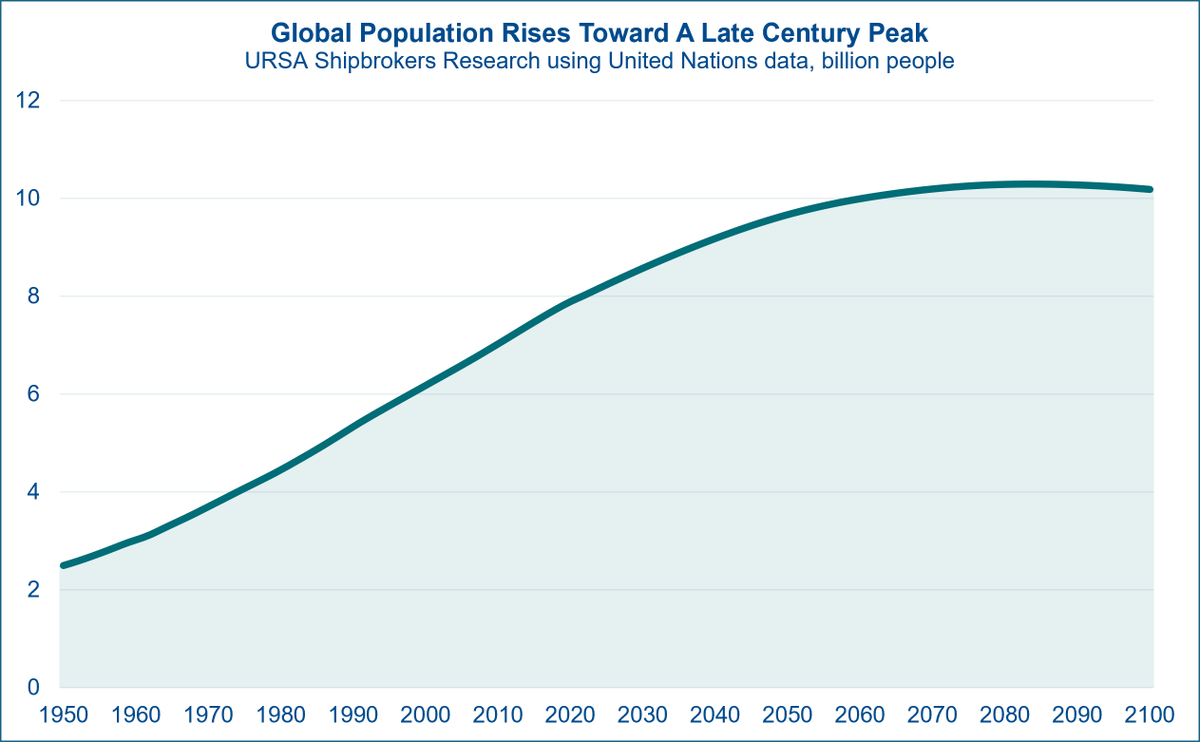
According to data from the Population Division of the Department of Economic and Social Affairs of the United Nations, the world's population is expected to reach 8.3 billion people in 2026, compared with an estimated 2.49 billion people in 1950.
It took around 37 years from 1950 for human numbers to double, surpassing 5 billion inhabitants in 1987, when the global population reached 5.05 billion.
From the 1976 level of 4.14 billion people, it has taken around 50 years for the global population to double again to its projected 2026 level.
The latest UN projections suggest that the global population could grow further to around 8.57 billion by 2030, 9.18 billion by 2040 and 9.66 billion by 2050.
The United Nations reports that more than half of the projected increase in the global population between 2022 and 2050 is expected to be concentrated in just eight countries: the Democratic Republic of the Congo, Egypt, Ethiopia, India, Nigeria, Pakistan, the Philippines and Tanzania.
The global population is projected to continue growing, albeit at a reduced rate, towards a forecast peak of 10.29 billion people in 2084, before ending the 21st century at around 10.18 billion people in AD 2100.
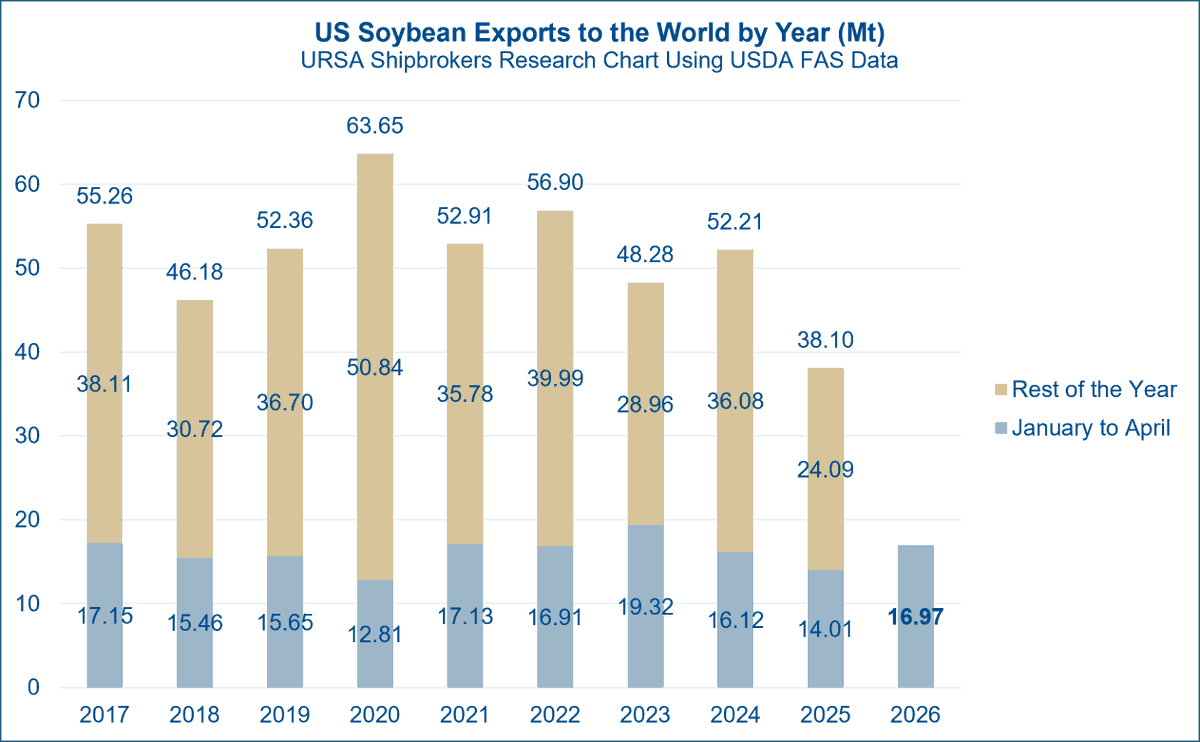
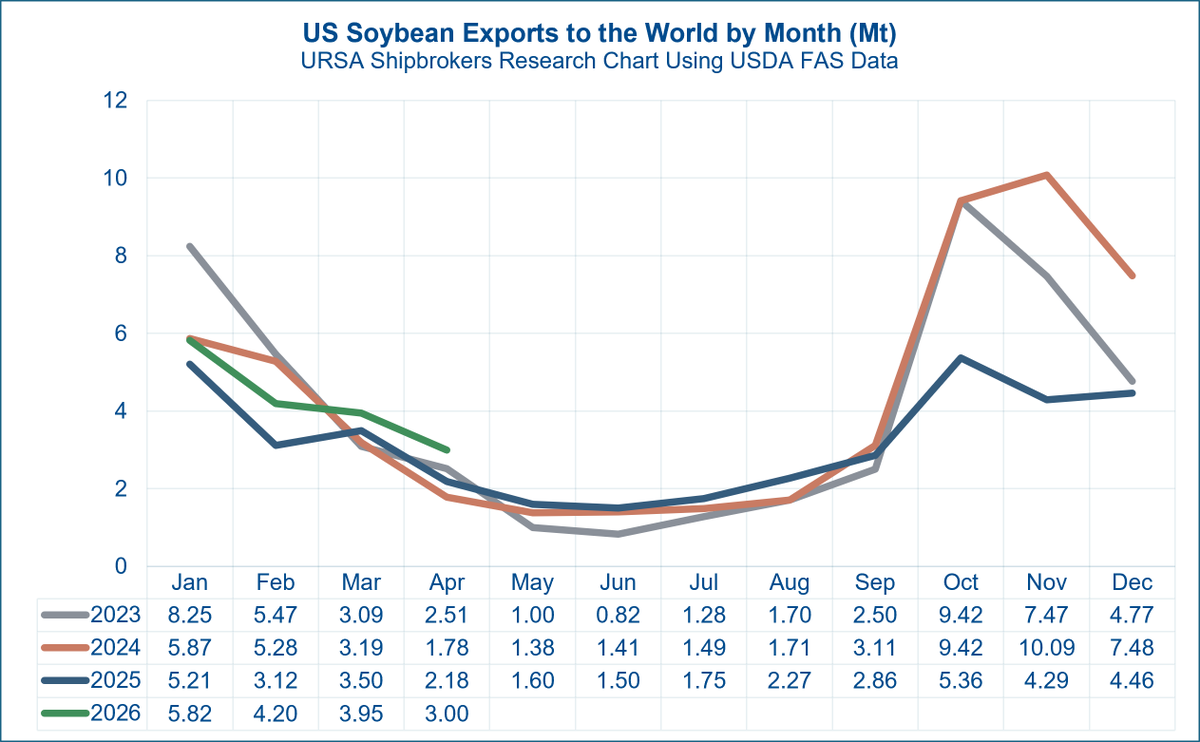
According to data from the Foreign Agricultural Service (FAS) of the United States Department of Agriculture (USDA), US soybean exports to all destinations and through all transport modes amounted to 3.0 million tonnes in April 2026, the most recent month of official US data. These flows include ocean shipments, mostly dry bulk with some containerised volumes, as well as inland waterway, truck and rail movements.
April 2026 exports of US soybeans to all destinations retreated seasonally by around 0.95 Mt, or 24.1% month on month, from 3.95 Mt in March 2026. However, they remained stronger on a year-on-year basis, standing 0.82 Mt, or 37.6%, above the 2.18 Mt exported in April 2025.
Thus far within 2026, more US soybeans are reaching international markets.
Aggregated export volumes for the January to April 2026 period are reported at 16.97 Mt, up by 2.96 Mt, or 21.1% year on year, against the same first four month interval last year (January to April 2025: 14.01 Mt). However, this comparison is also being made against a historically weak baseline, with January to April 2025 having formed the second weakest such period in the last ten years, behind only January to April 2020 at 12.81 Mt.
Last year's weak January to April baseline had largely formed before the 2 April 2025 "Liberation Day" tariffs, amid broader trade policy uncertainty and renewed strain between the US and China, its main soybean customer. The 30 October 2025 meeting between President Donald Trump and Chinese leader Xi Jinping at the APEC summit in Busan, South Korea, later helped market expectations around US agricultural exports become less constrained.
On a marketing year (MY) basis, January to April 2026 falls within the 2025/26 US soybean MY, which runs from September 2025 to August 2026.
Across the concluded months of the 2025/26 MY so far, from September 2025 to April 2026, a total of 33.94 Mt of US soybeans is reported to have been exported. With the full MY export forecast from the USDA pegged at 41.10 Mt, this would potentially leave another 7.16 Mt to be exported by the conclusion of the MY in August 2026.
That remaining volume would sit within the tail end of the US soybean export season and is not dissimilar to last year's May to August 2025 period, when exports amounted to 7.12 Mt.
After August 2026, the upcoming 2026/27 MY, running from September 2026 to August 2027, is forecast to see US soybean exports rebound by around 3.26 Mt, or 7.9% year on year, to 44.36 Mt. Even so, this would still sit well below the 2020/21 export peak of 61.66 Mt.
Latest Monthly Figures
Official data from the General Administration of Customs of the People's Republic of China, GACC, show that coal imports from all origins and across all types into China came to 33.26 million tonnes in May 2026, the most recently concluded calendar month on record. China remains the world's largest coal producer, importer and consumer.
May 2026 total coal imports into China rose marginally by 0.18 Mt, or 0.6% MOM, from April 2026 at 33.08 Mt. However, they fell by 2.77 Mt, or 7.7% YOY, against May 2025 import volumes of 36.04 Mt, marking the second consecutive month of YOY retreat for Chinese coal imports.
Origins and Supplier Mix
For May 2026, 12.37 Mt came from top supplier Indonesia, while another 9.90 Mt came through overland routes from Mongolia. China imported a further 5.46 Mt of coal from Russia, 4.03 Mt from Australia and 1.51 Mt from various other sources, completing the monthly total for last month.
January to May coal imports were down 3.2% YOY at 182.62 million tonnes, according to China Customs data.













![d_tsilioris's tweet photo. EU Corn Imports Rise As Output Falls
According to the latest data from the United States Department of Agriculture (USDA), corn consumption across the 27 member states of the European Union (EU) is estimated at 74 Mt during the ongoing 2025/26 Marketing Year (MY), spanning October 2025 to September 2026. This is down from 77 Mt in the previous 2024/25 MY.
The softer consumption outlook coincides with a continued contraction in the bloc's swine sector, an important source of feed demand. USDA data indicate that EU swine production is expected to decline to 228 million head in calendar year 2026, from 230 million in 2025, while total slaughter is projected to fall from 229 million to 225 million head. Ending inventories are also forecast to decrease to 124.2 million head, from 127 million a year earlier.
Meanwhile, EU corn production is estimated at 56.8 Mt in 2025/26, down 2.79 Mt, or 4.7%, from 59.59 Mt in 2024/25. Looking ahead to the 2026/27 MY, spanning October 2026 to September 2027, consumption is forecast to edge higher to 74.4 Mt, while production is projected to decline further to 53.78 Mt. This would widen the gap between consumption and domestic output to 20.62 Mt, from 17.2 Mt in the ongoing MY.
Consequently, the EU's corn self sufficiency is estimated to fall from 77.4% in 2024/25 to 76.8% in 2025/26, before declining more sharply to 72.3% in 2026/27.
Corn imports are estimated at 18.5 Mt in the ongoing MY, down marginally by 0.26 Mt, or 1.4%, from 18.76 Mt in 2024/25. However, imports are forecast to rise by 4 Mt, or 21.6%, to 22.5 Mt in 2026/27. This would mark the highest volume since 2022/23, as falling domestic production increases the need for external supplies despite only a marginal recovery in consumption.
Beyond the baseline forecast, there may be some upside for EU ocean bulk corn imports during 2026/27. Renewed attacks on Ukrainian port infrastructure and increased caution among shipowners have reduced Black Sea grain export capacity and created uncertainty around Ukraine's ability to supply the bloc [1][2].
Should these constraints persist, a greater share of EU requirements could be sourced from more distant origins such as the United States and Brazil. Brazil's main safrinha crop is harvested largely between June and September, while fresh US supplies become available during the autumn harvest. Both seasonal windows broadly coincide with the opening months of the new EU MY and could support longer haul seaborne volumes into the bloc.
References:
[1] Pavel Polityuk, "Ukraine's Black Sea Ports Lose a Third of Grain Export Capacity Farmers' Union Says", Reuters, 15 July 2026.
[2] Anna Pruchnicka and Yuliia Dysa, "Shipowners Halt Calls at Ukraine's Black Sea Ports Wary of Russian Strikes", Reuters, 23 July 2026.](https://pbs.twimg.com/media/HOS8bI6WsAAULnN.png)
![d_tsilioris's tweet photo. China Iron Ore Imports Mark Strongest June
According to data from the General Administration of Customs of the People's Republic of China (GACC), the country's iron ore imports reached 112.69 million metric tonnes in June 2026, the most recent month for which data are available.
Iron ore is the primary raw material used in blast furnace steelmaking and represents the dry bulk market's largest commodity trade by volume, with China accounting for an estimated 75% of global seaborne iron ore imports.[1]
Chinese iron ore imports in June 2026 recorded a 15.3% month on month increase, equivalent to 14.98 Mt, from 97.71 Mt in May. Volumes were also 6.5%, or 6.90 Mt, higher year on year compared with 105.79 Mt in June 2025.
The June increase marked a return to year on year growth following the brief interruption recorded in May 2026, when imports declined by 0.2%. This followed eleven consecutive months of year on year increases from June 2025 to April 2026 and remains supportive of vessel employment, particularly for the larger dry bulk vessels typically deployed in the trade, namely Capesizes.
At 112.69 Mt, Chinese iron ore imports in June 2026 were the highest recorded for any June during the current decade.
Strong First Half Performance
June's strength, together with robust import volumes earlier in the year, brought cumulative Chinese iron ore imports during 1H 2026 to 628.87 Mt. This was 37.48 Mt, or 6.3%, higher year on year compared with 591.39 Mt during 1H 2025 and marked the strongest first half of the current decade.
Steel Output Remains Weaker
The strength in iron ore imports appears, at first glance, to contrast with weaker crude steel production. According to the National Bureau of Statistics of China, the country produced 499.95 Mt of crude steel during 1H 2026, down 14.88 Mt, or 2.9%, year on year from 514.83 Mt during 1H 2025. Nevertheless, June output reached 83.67 Mt, representing a modest increase of 0.48 Mt, or 0.6%, compared with June 2025.
Domestic Iron Ore Output Declines
Part of this apparent divergence may be explained by the sharper decline in China's domestic crude iron ore production. Output fell to 466.86 Mt during 1H 2026, down 41.74 Mt, or 8.2%, year on year. The contraction was particularly pronounced in June, when production declined by 18.59 Mt, or 20.9%, year on year to 70.37 Mt.
It should be noted, however, that China's crude iron ore production is reported on a gross run of mine basis and is therefore not directly comparable tonne for tonne with generally higher grade imported iron ore.
References
[1] Clyde Russell, "China's Steel Sector Looks Weaker Than It Is, Reverse for Iron Ore", Reuters, 21 July 2026.](https://pbs.twimg.com/media/HOORbDbWoAAyYHt.png)