Here are two scenarios I often look at after a breakout.
Scenario A: The breakout happens, and then the price makes a shallow pullback towards the 10/20 EMA. It spends a few days correcting, comes closer to the moving average, finds support and starts moving up again.
Scenario B: The breakout happens, but instead of pulling back, the price simply goes sideways. Since the 10/20 EMA is a fast-moving average, it slowly catches up with the price while the stock remains stuck in a range.
Both scenarios can work.
But I generally prefer Scenario A.
The reason, In A, the price is actually correcting and finding support near the EMA. In B, the price hasn't really made progress after the breakout. The EMA is only catching up because the stock has gone sideways.
For me, a controlled pullback to the EMA is usually a healthier sign than the EMA catching up to a stalled price.
#Trading
Market Wizard Linda Reschke's 12 Technical Trading Rules:
1. Buy the first pullback after a new high. Sell the first rally after a new low.
2. Afternoon strength or weakness should have follow through the next day.
3. The best trading reversals occur in the morning, not the afternoon.
4. The larger the market gaps, the greater the odds of continuation and a trend.
5. The way the market trades around the previous day’s high or low is a good indicator of the market’s technical strength or weakness.
6. The previous day’s high and low are two very important “pivot” points, for this was the definitive point where buyers or sellers came in the day before. Look for the market to either test and reverse off these points, or push through and show signs of continuation.
7. The last hour often tells the truth about how strong a trend truly is. “Smart” money shows their hand in the last hour, continuing to mark positions in their favor. As long as a market is having consecutive strong closes, look for up-trend to continue. The up trend is most likely to end when there is a morning rally first, followed by a weak close.
8. High volume on the close implies continuity the next morning in the direction of the last half-hour. In a strongly trending market, look for resumption of the trend in the last hour.
9. The first hour’s range establishes the framework for the rest of the trading day.
10. A greater percentage of the day’s range occurs in the first hour then was the case in the past, and thus it has become increasingly important to trade aggressively if there are early signs of a strong trend for the day.
11. There are four basic principles of price behavior which have held up over time. Confidence that a type of price action is a true principle is what allows a trader to develop a systematic approach.
The following four principles can be modeled and quantified and hold true for all time frames, all markets. The majority of patterns or systems that have a demonstrable edge are based on one of these four enduring principles of price behavior.
Charles Dow was one of the first to touch on them in his writings. Principle One:
A Trend Has a Higher Probability of Continuation than Reversal Principle Two:
Momentum Precedes Price Principle Three:
Trends End in a Climax Principle Four:
The Market Alternates between Range Expansion and Range Contraction!
12. In the world of money, which is a world shaped by human behavior, nobody has the foggiest notion of what will happen in the future. Mark that word –
Nobody! Thus the successful trader does not base moves on what supposedly will happen but reacts instead to what does happen.
The blueprint that turned qullamaggie into a multimillionaire trader:
Kristjan Kullamägi, better known as Qullamaggie, is a self-made multimillionaire trader from Stockholm, Sweden, who has grabbed the attention of traders around the globe with his incredible rise, disciplined strategy, and refreshingly simple approach
Breakouts get all the attention. But some of the best trades often come after the excitement fades.
I made a video on pullback trading and shared how I look at these setups.
🟢Wait is finally over !!!!!
✅Giveaway of Model book -2 for 5 Star setup Containing 50 charts.
✅Elevate your Chart Reading Skills by Reviewing just 50 Charts.
✅50 detailed real - world Examples to Transform your Trading & Shorten your Learning curve.
📌Comment " Model Book & " Like + Retweet & DM me for 5 Star Setup Model book (Need to follow @pheonix_trader
for DM)
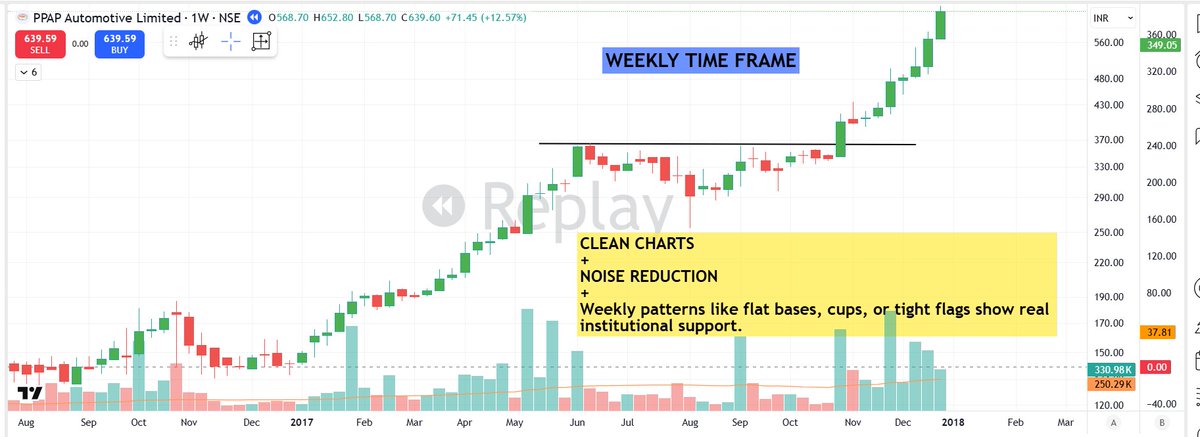
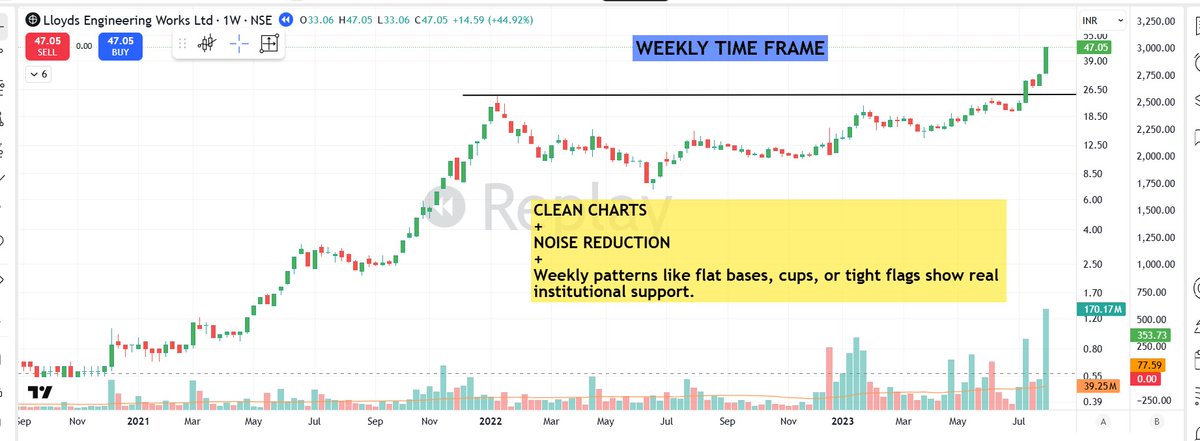
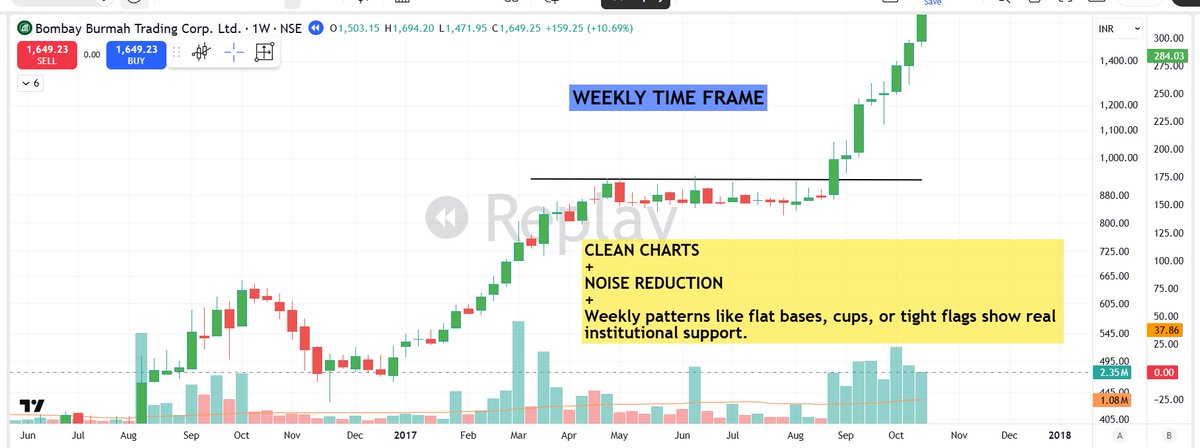
📌Most traders get lost in the daily noise. Professionals zoom out.
Weekly charts 📊are one of the most powerful tools in trading. Here’s why
1⃣Noise Reduction:
Daily swings look dramatic, but weekly closes reveal true direction. Less clutter, more clarity.
2⃣Trend Confirmation:
A stock above rising WMA10 on the weekly is in a healthy uptrend — no guesswork needed
3⃣Stronger Bases:
Weekly patterns like flat bases, cups, or tight flags show real institutional support.
4⃣Volume Perspective:
Weekly volume spikes highlight accumulation better than any single day can.
5⃣Patience Builder:
When you zoom out, you stop chasing every tick and focus on structure.
6⃣Leadership Test:
Big winners hold their trends on weekly charts — laggards fail here.
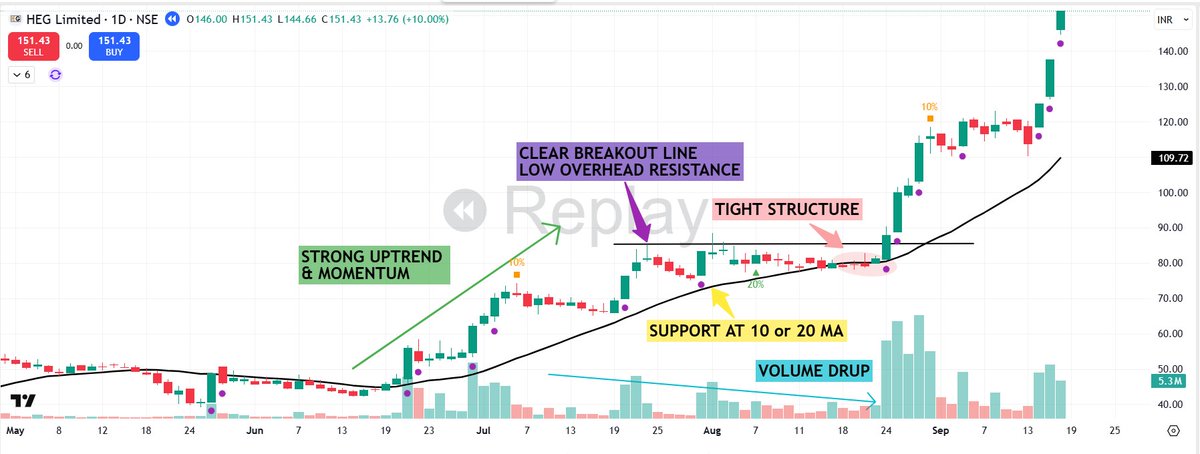
🟢7 Characteristics of a Great Breakout💥💥Setup 👇
1⃣Tight Structure :-
The volatility inside the base must "DRY UP". You want to see the daily ranges getting smaller & smaller - Price compressing like Spring. Each contraction tells you that weak hands are out , Sellers are done.
2⃣Strong Uptrend & Momentum :
Before forming its base, the stock should already be up at least +50%, often closer to 100%. True leaders don't start from lows- they continue from strength.
3⃣Support at 10 or 20 MA :
A strong stock respects its moving average. During the base, price should hold MA 10 or MA20.
4⃣Volume Contraction & Accumulation
Inside the base, Volume should contract showing reduced supply - but you also want to see accumulation spikes.
5⃣Relative Strength leadership:
The stock must be stronger than the indices and its sector peers.
6⃣Strong Catalyst or Theme:
Every big winner has a reason behind it. You want clear fundamental fuel
7⃣Clear Breakout Line & Low overhead Resistance:
The Breakout level should be obvious - tested multiple times , forming a clean pivot
📌I am a Momentum Trader
I follow momentum — because that’s where the real money in #Stocks is made.
Here’s the simple idea 👇
1⃣Start with strength:
I’m not interested in cheap stocks or “bottoms.” I want stocks already moving fast. +30%, +50%, +100% moves — that’s where institutions are active.
2⃣Look for tight consolidation:
After a strong move, the stock should calm down. Small candles. Lower volatility. No heavy selling. That’s not weakness — that’s controlled demand.
3⃣Wait for structure:
If the stock goes straight up and then trades sideways for a few days, it creates a clear level. That’s where I prepare — not before.
4⃣Enter with a plan:
I don’t chase. I enter when I can define my risk. Usually 3–5%. If I can’t place a tight stop, I skip the trade.
5⃣Risk defines everything:
Small losses are part of the game. But when the stock works, the upside can be +50% to +100%, even more. That’s asymmetric.
6⃣Momentum builds momentum:
Strong stocks tend to stay strong. Not always — but often enough to build an edge over time.
📌Most #traders think #trading is hard.
It’s not.
Waiting for great setups is. ⏳ .
Here’s the reality👇
1⃣No Setup, No Trade:
I don’t care how strong a stock looks. If my setup isn’t there, I pass. Every time.
2⃣Noise Is The Enemy:
News, opinions, random breakouts — I ignore all of it. It’s not my process.
3⃣Patience Feels Wrong:
When nothing happens, you feel like you’re missing out. That feeling is the test.
4⃣Setups Always Come Back:
I’ve seen it for years. The same patterns repeat. The opportunity returns.
5⃣Waiting Is The Edge:
Most traders can’t do it. That’s exactly why it works. I don’t get paid for being active. I get paid for being selective.
Extreme patience → clear, high-quality setups.
💥Sharing complete framework of "3 WEEK TIGHT CLOSING - 3WTC STRATEGY - WEEKLY SYSTEM "
📌This Strategy can be beneficial for working professional
With some Real - world examples 👇