Organization of DataViz Award "Make Your Data Speak" & Eurasian Dataviz Conference.
BI-systems deployment | Analysts training | Data-Driven culture promotion
Exploring the Power BI Feature: Multiple Data Labels
Have you ever heard of the multiple data labels feature in Power BI? Despite being available for a few months now, it seems like this feature hasn't been getting much attention.
Dive into the MYDS 2023 Recordings!
We’re continuing to release recordings from the event, packed with invaluable insights and engaging discussions.
@Altiziana, @pierozagami, Manuel Lima, @sarahlovesdata@prem_prasann
https://t.co/HDZ5x7kWXc
Unlocking the Power of Slicers!
In this post, I've prepared a checklist where I demonstrate how to create and customize slicers step-by-step. After watching the video, don't forget to share your thoughts and let me know if you use slicers in your data visualization projects!
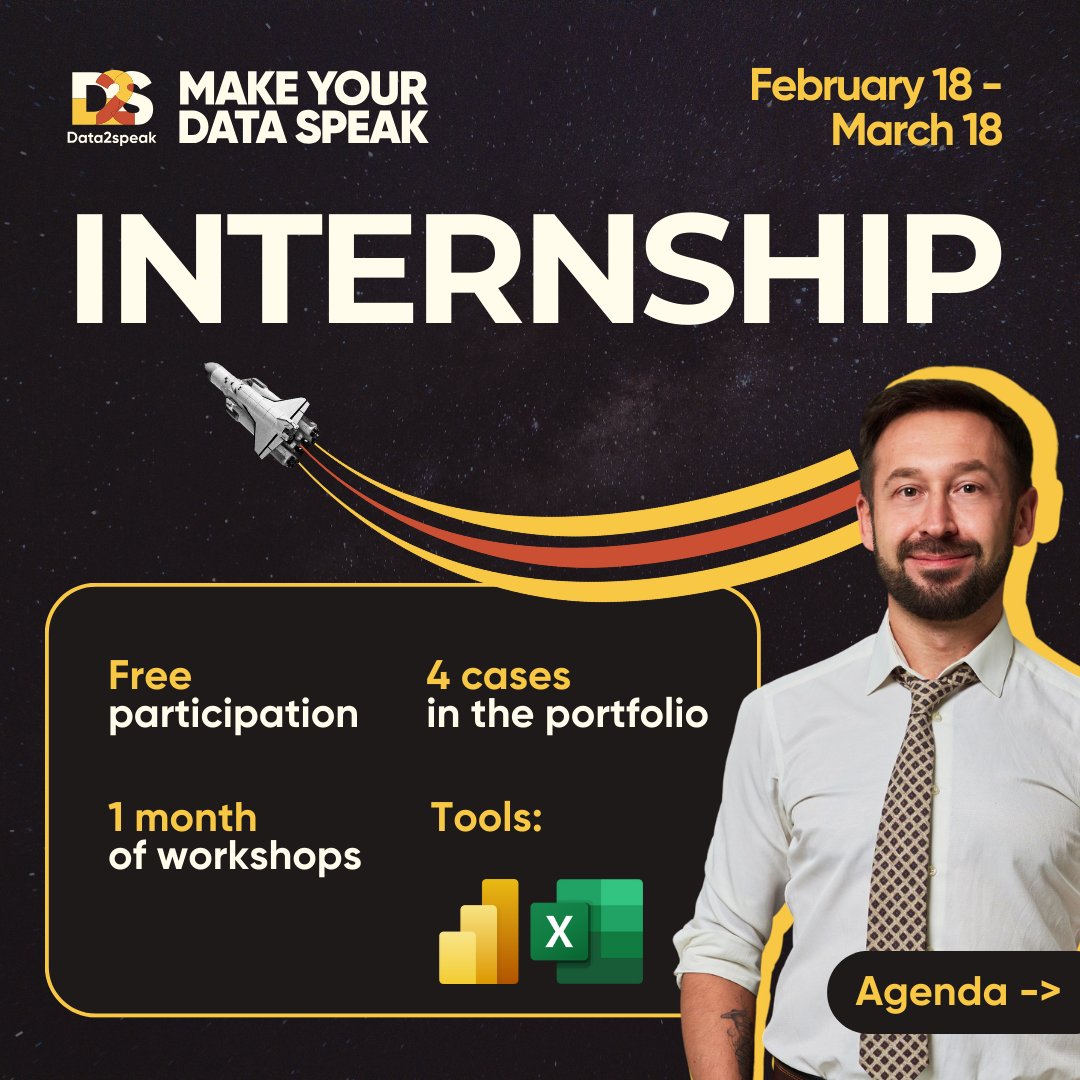
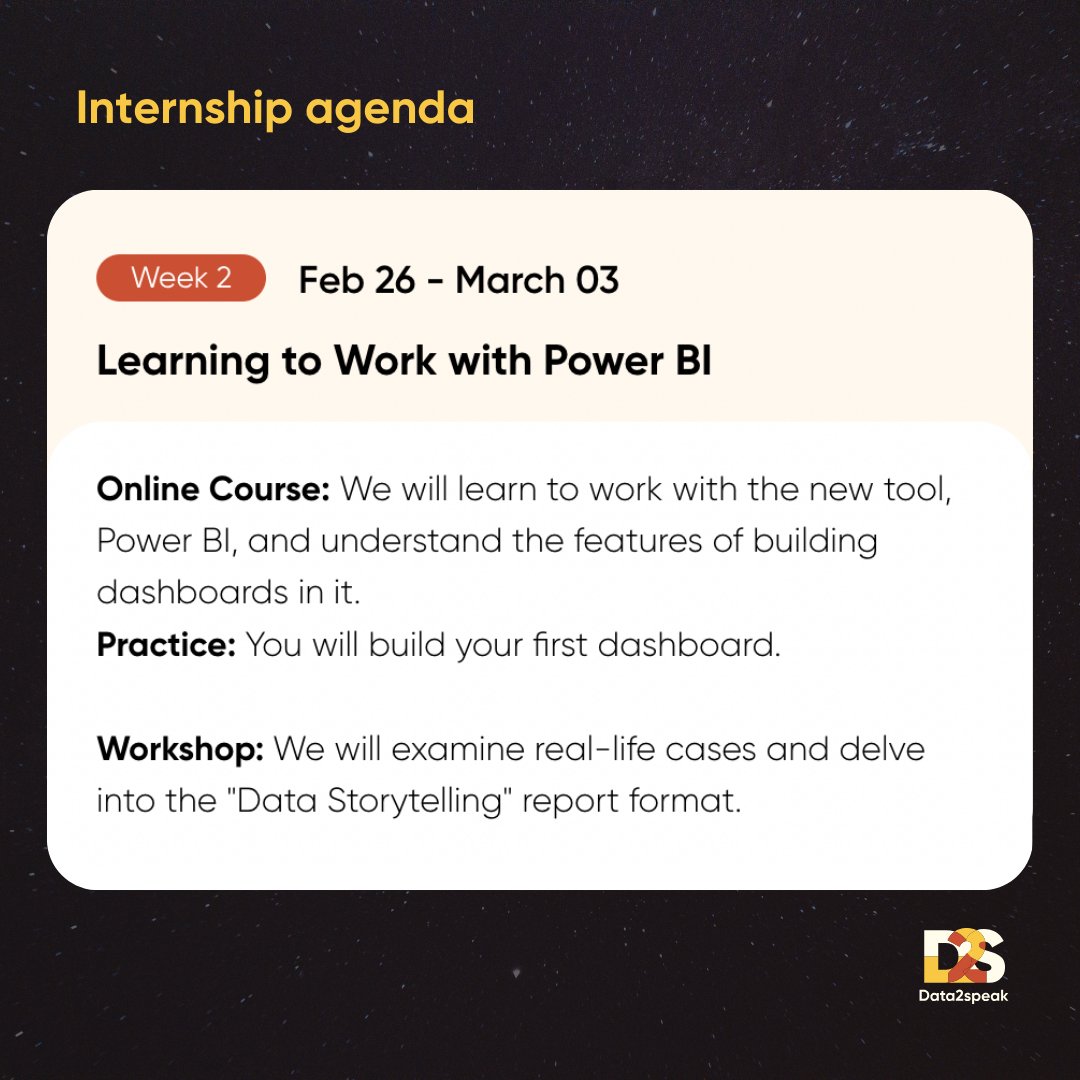
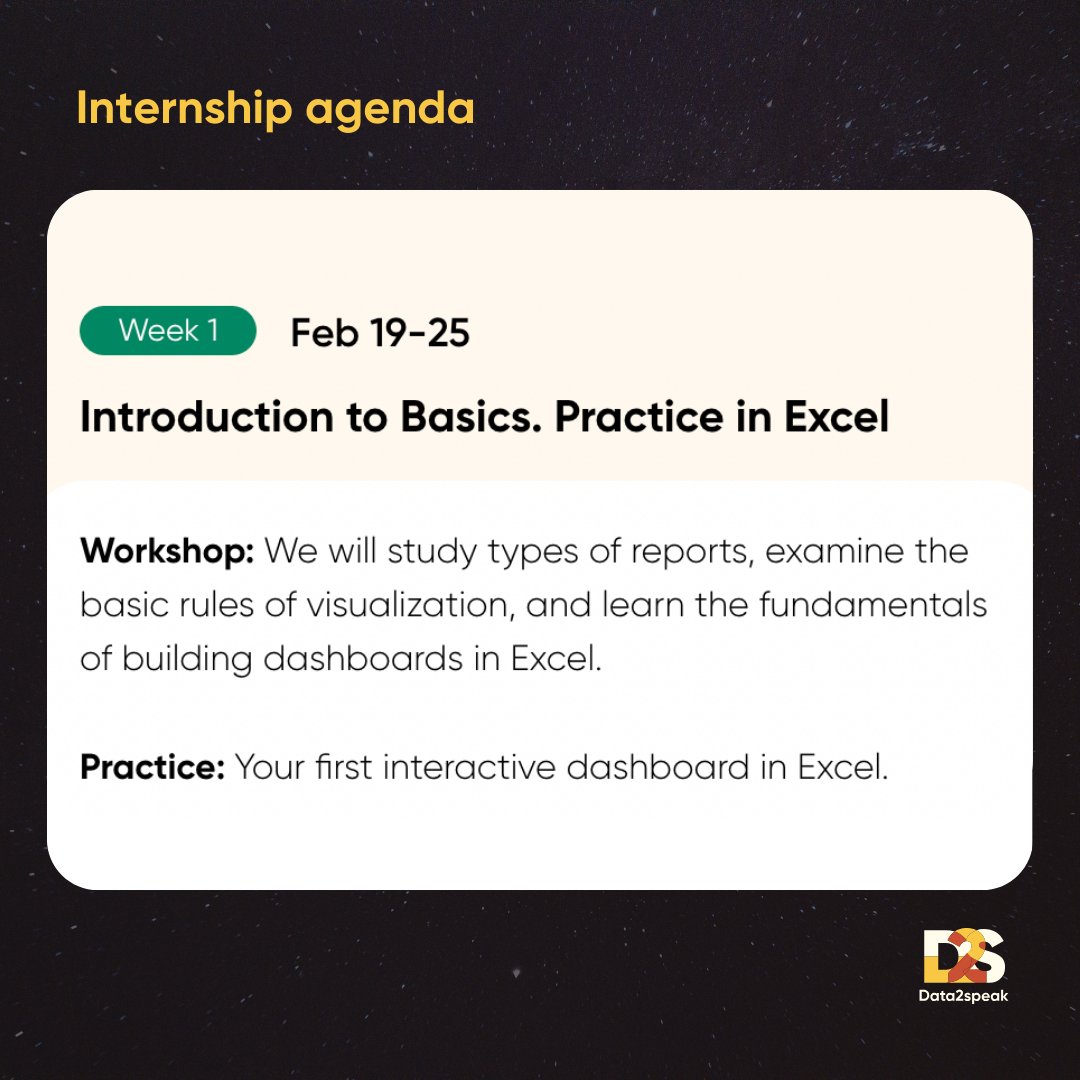
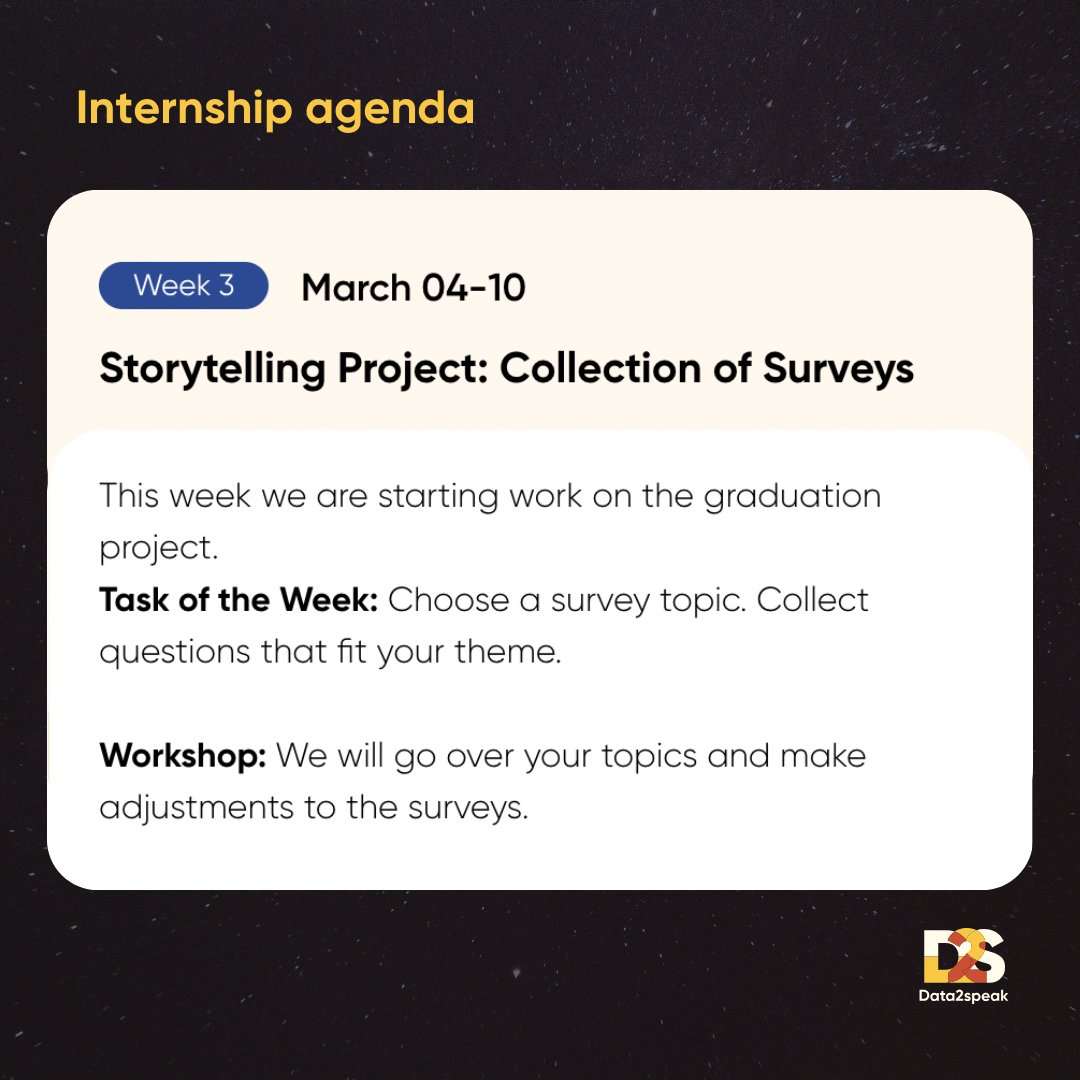
Free Internship for MYDS Award 2024!
Duration: 1 Month Format: Recorded Sessions & Weekly Online Workshops
How to Apply:
To be considered for this exciting internship opportunity, simply complete a test task and submit your application today!
https://t.co/ZtIetrDO7i
Join Our Webinar: MYDS Award 2024 Jury Members Unveil Secrets to Success!
Our first webinar featuring the esteemed jury members of the MYDS Award 2024 is just around the corner, and you're invited to join us!
Date: February 9
Time: 2:00 PM GMT
https://t.co/5q70is4UiH
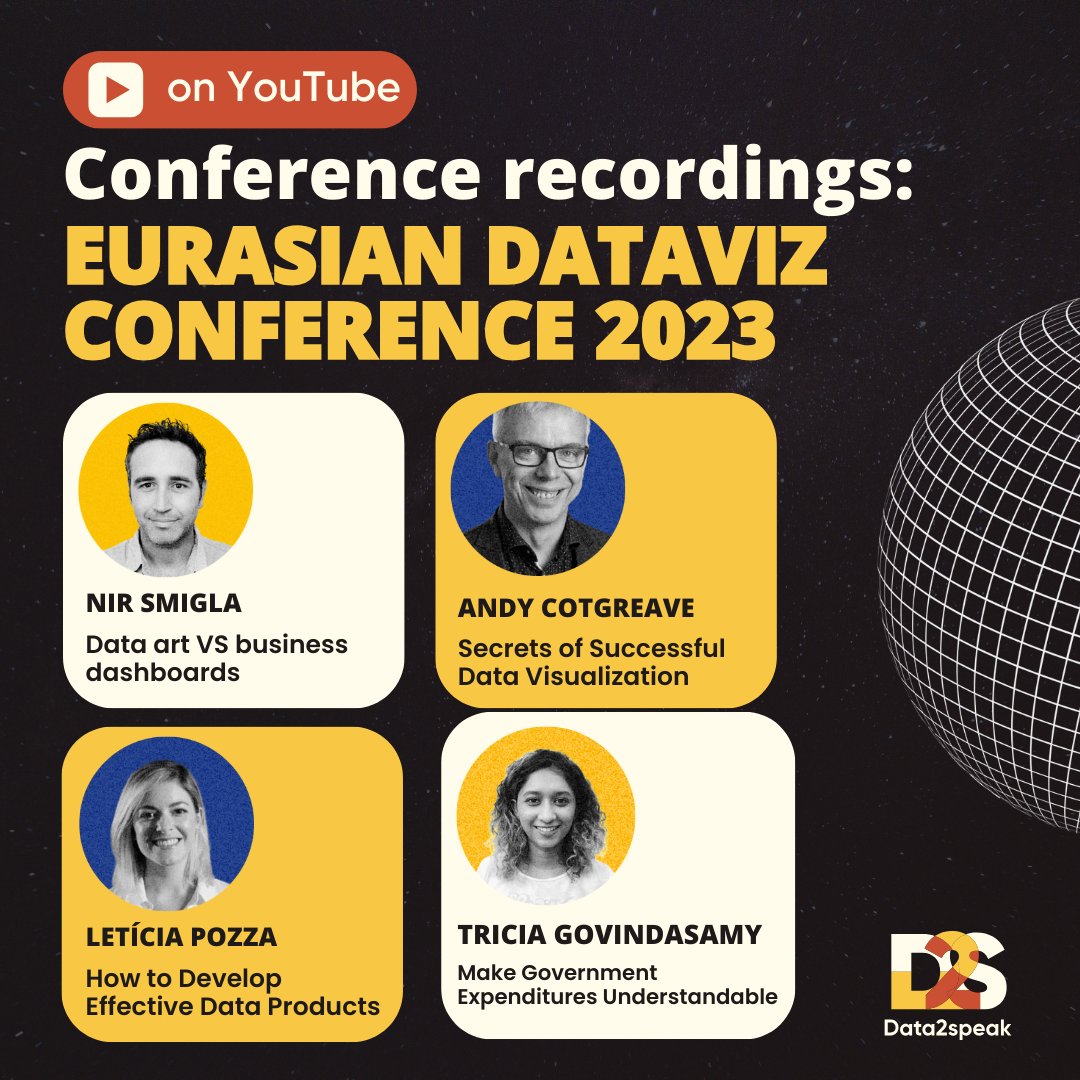
We've just released 4 captivating recordings from the MYDS 2023 conference on our YouTube channel, and they're now available for public access.
@SmilgaNir, @Data_Sommelier , @acotgreave , @triciagov
Don't miss out on these enlightening sessions! Head over to our YouTube channel!
Line Charts in the Wild
I frequently encounter the necessity to illustrate timelines, analyzing shifts in a metric over time. In such instances, a variety of tasks may present themselves.
This article is all about these types of charts! Read it: https://t.co/oNRSQ7ULn8
How to create a visual element
This year, in Make Your Data Speak Award, new category is introduced: Visual Element Creation. To clarify what is meant by this, I decided to provide a detailed account of our experience in developing such a product.
https://t.co/lqJ42N8Sr7
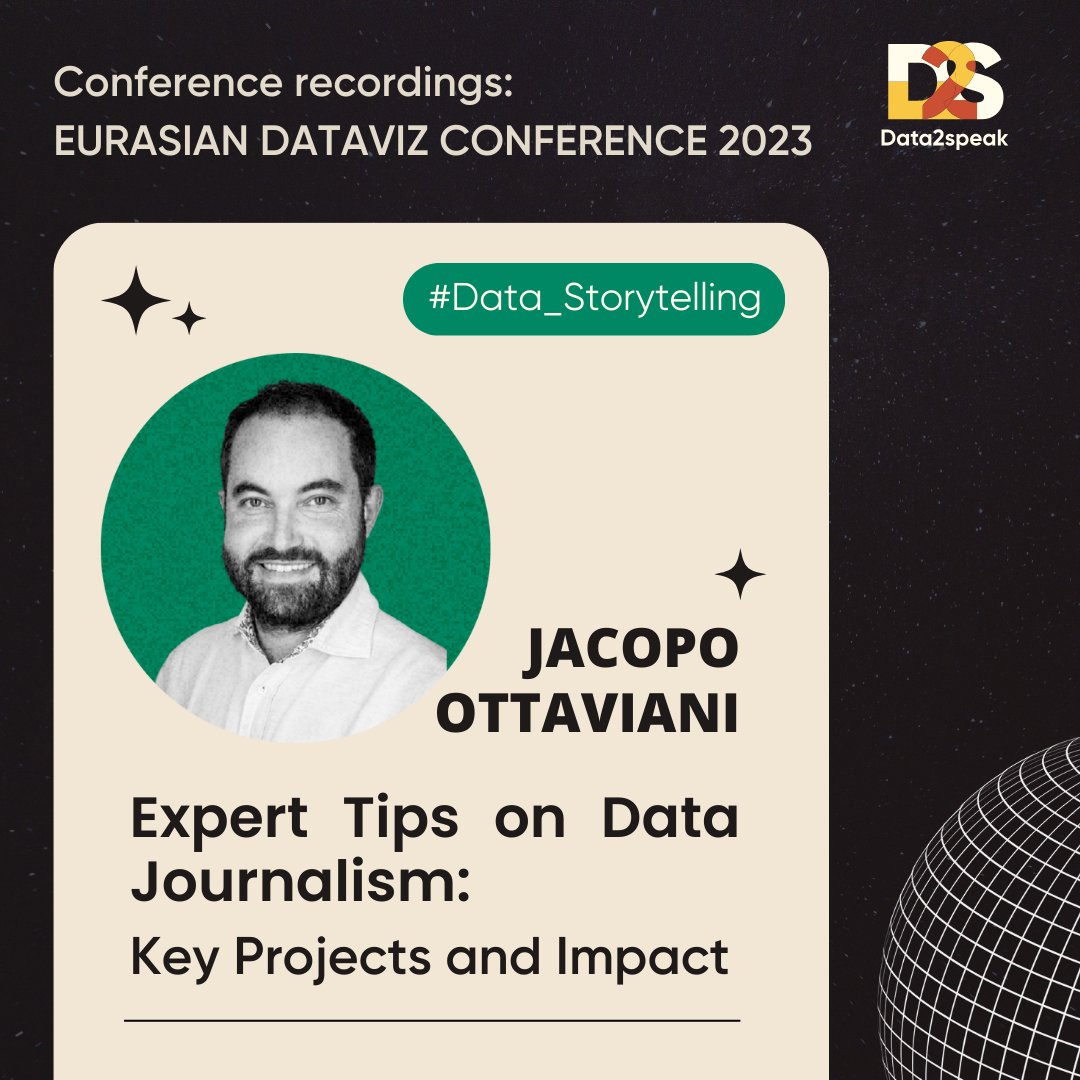
We've officially kicked off the release of MYDS 2023 conference recordings, and the first one is the speech by Jacopo Ottaviani.
In this video, Jacopo Ottaviani shares his experience in data journalism, discussing best practices and key projects.
https://t.co/PvUKej2iA9
We are now accepting applications, and the submission period will close on April 1, 2024. The award ceremony for the winners will take place at the conference on May 10!
Feel free to visit our competition website and register for the Awards!
https://t.co/3wdTz1jkwZ
In terms of the award, the categories will be expanded beyond the standard ones, such as Data Storytelling and Business Dashboards, to include experimental categories. These include creating your own visual element and an AI experiment.
https://t.co/3wdTz1jkwZ
I am pleased to announce that in the spring of 2024, we plan to recreate this experience. Taking into account the lessons learned and any delays, we will strive to make the event more engaging and convenient for all participants.
https://t.co/3wdTz1jkwZ
I'm eagerly anticipating the adventures and projects that 2024 will unfold. Here's to more innovations, collaborations, and data-driven journeys!
Wishing you all a Merry Christmas and a happy New Year!
Click by link to receive a Christmas prediction https://t.co/2TD5qjiaGz
5. Medium Journal Launch:
Our Medium journal became a hub for insightful articles throughout the year. If you haven't explored it yet, head over to catch up on valuable content, tips, and trends.
4 "Make Your Data Speak: Creating Actionable Data through Excel For Non-Technical Professionals," hits the shelves this year, offering accessible insights for all levels of technical proficiency in MS Excel. Exciting news - a new book focused on Power BI will release in 2024!
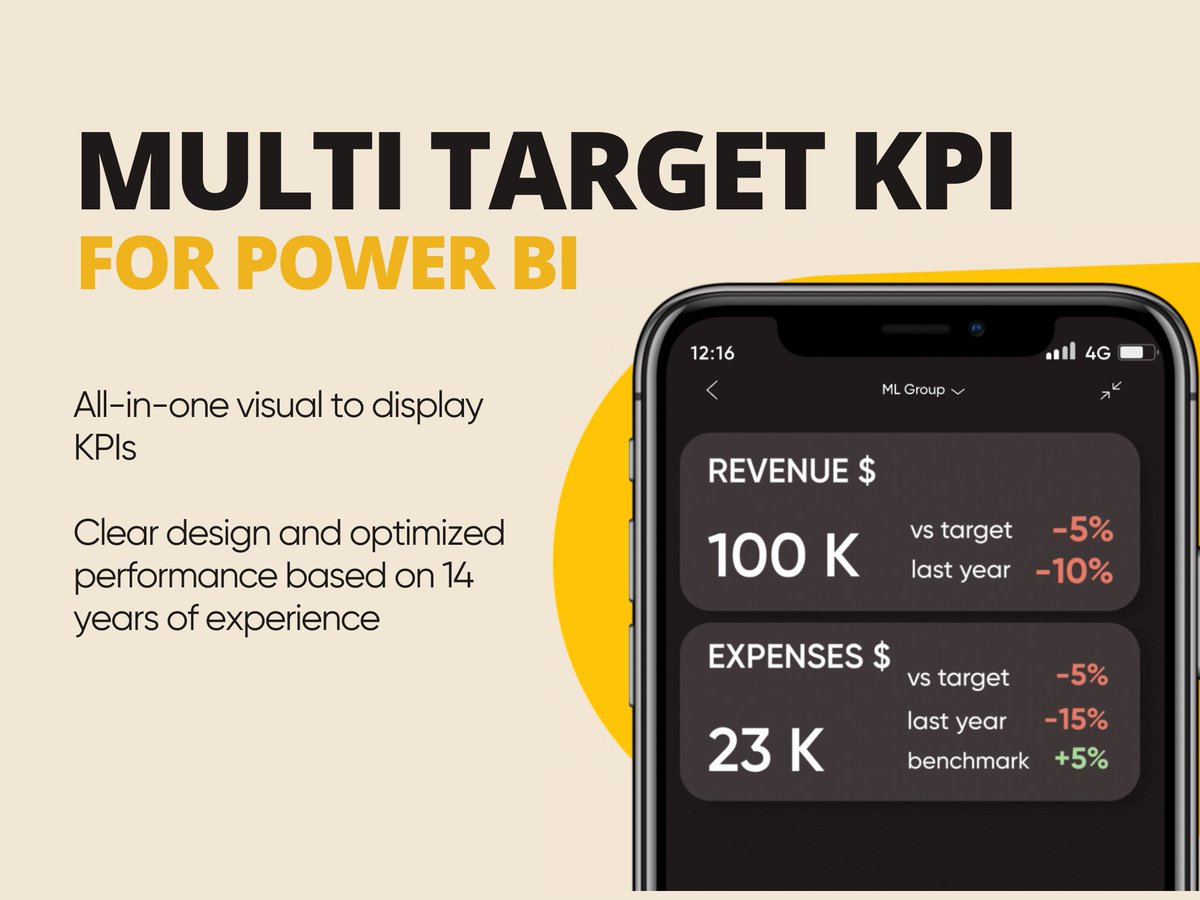
3. Multi-Target KPI Visual Updates:
Our work on the Multi-Target KPI visual continued to evolve. We released a new version on Appsource Gallery with crucial bug fixes, and stay tuned for an upcoming 2024 release with a game-changing new feature. We can't wait to share the details
2. The Guideline - Dashboards Templates for Power BI:
This year marked the launch of our newest product! It's been a journey of conceptual changes and meticulous planning, culminating in a product that we're incredibly proud of. Check it out and elevate your Power BI dashboard !
Dear friends, as we approach the festive season, we want to take a moment to express our heartfelt gratitude and share the fantastic highlights that made 2023 an extraordinary year for us!
1. Eurasian Data Visualization Conference and Awards
As we bid farewell to this eventful year, there's a particular highlight that deserves a special mention—the "Make Your Data Speak" conference and awards!
The success of the event is indebted to the incredible contributions from our esteemed juries and speakers.
New article about life hacks for optimizing dashboard is published in MYDS Journal!
I recommend a few techniques that might ease the workload of your product, speed it up, and optimize its performance in the new article.
https://t.co/TuygxqGNV0