eurostat.js: "Reusable library to quickly create and customise web maps showing data directly retrieved from @EU_Eurostat database" https://t.co/lKqZoUSX01
I especially like the dot pattern maps :)
New #dataviz project with @CesiumJS
🚇 Metrocyclopaedia | Interactive map of all #metro#subway systems of the world 🕹👁 Sneak peek: https://t.co/11rdud0lA0
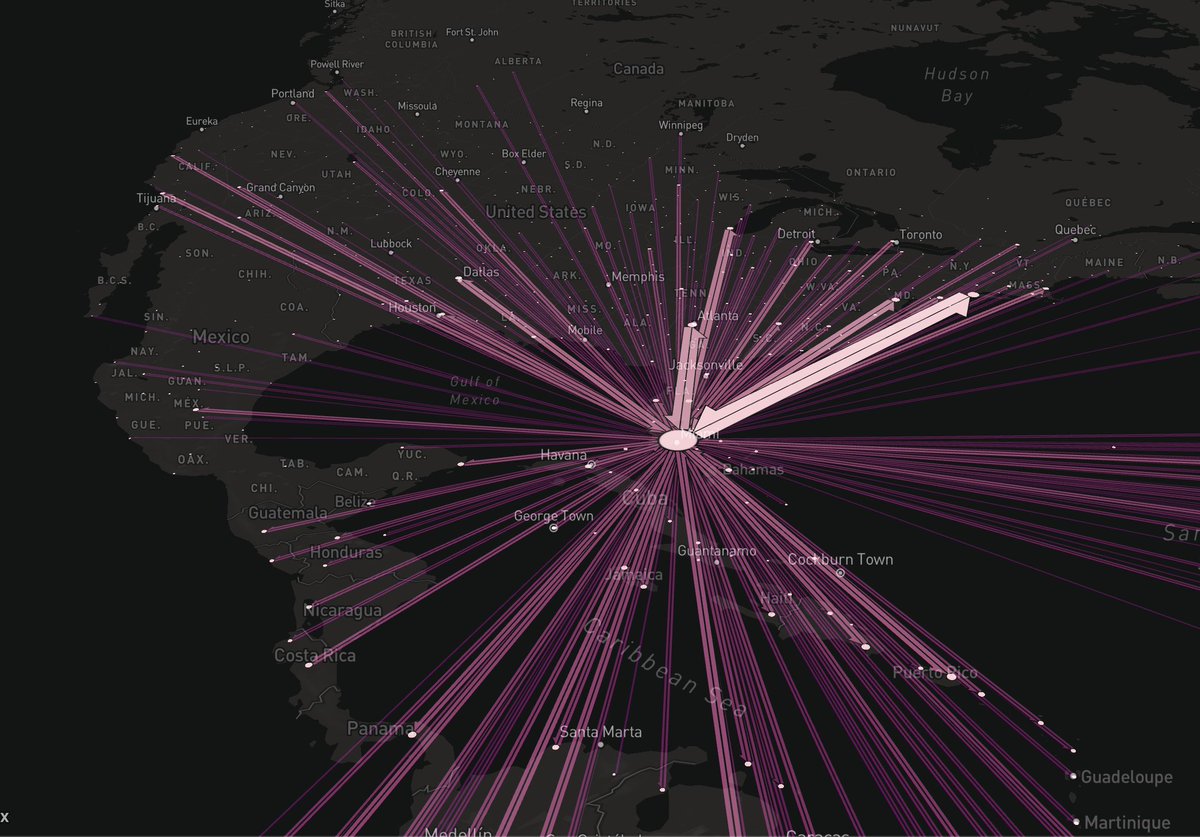
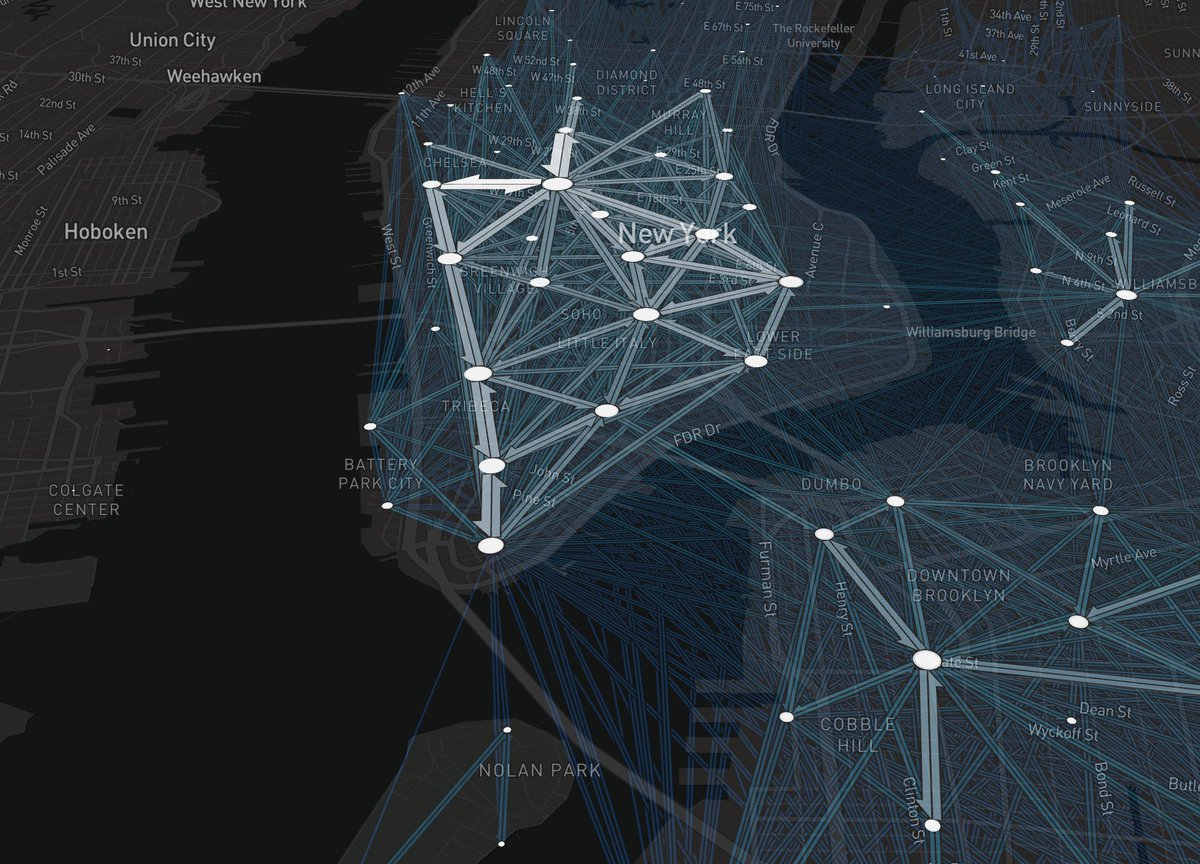
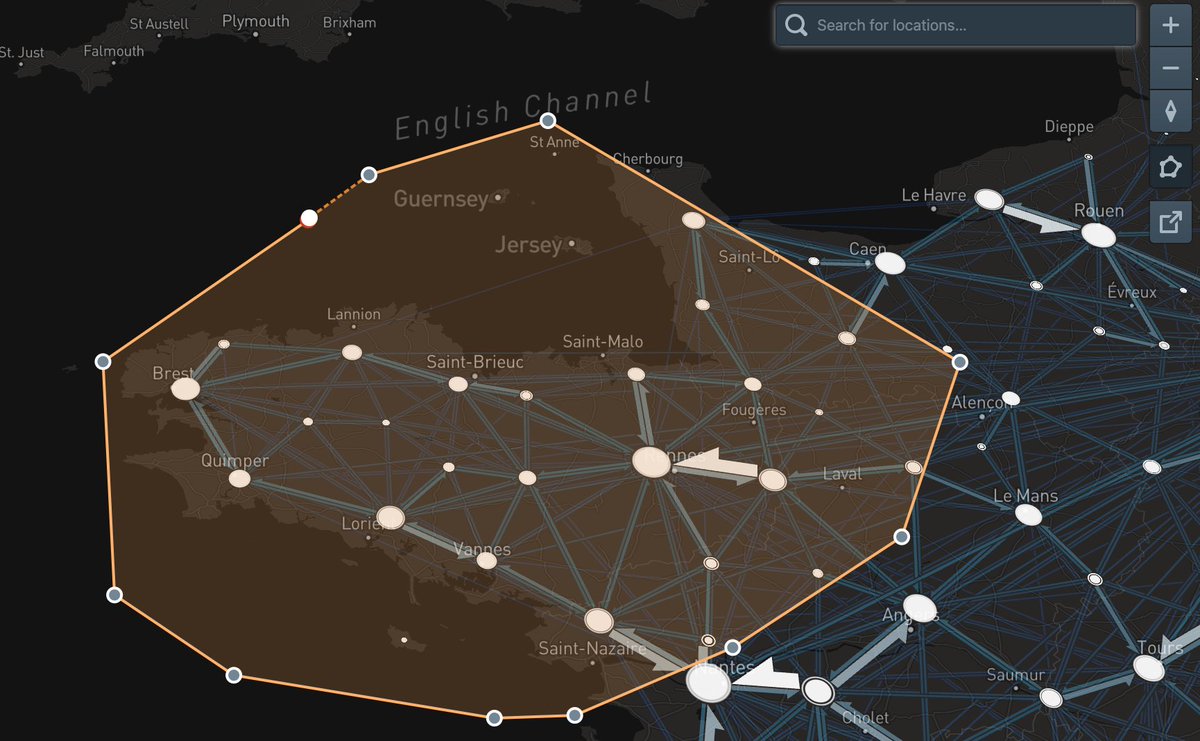
The first issue of the https://t.co/OdMIOpczte newsletter https://t.co/TFlfAEZjEi describing the latest features:
- lasso selection,
- camera rotation and tilting,
- new location/flow filtering modes.
Subscribe to the newsletter @ https://t.co/UuVNbkAvsv
🏭How the UK has transformed its electricity supply in a decade ☀
...and how things are expected to continue changing.
Me and @DrSimEvans have been working on this interactive for over a year! #netzero@CarbonBrief https://t.co/Lon6Ih0oeB