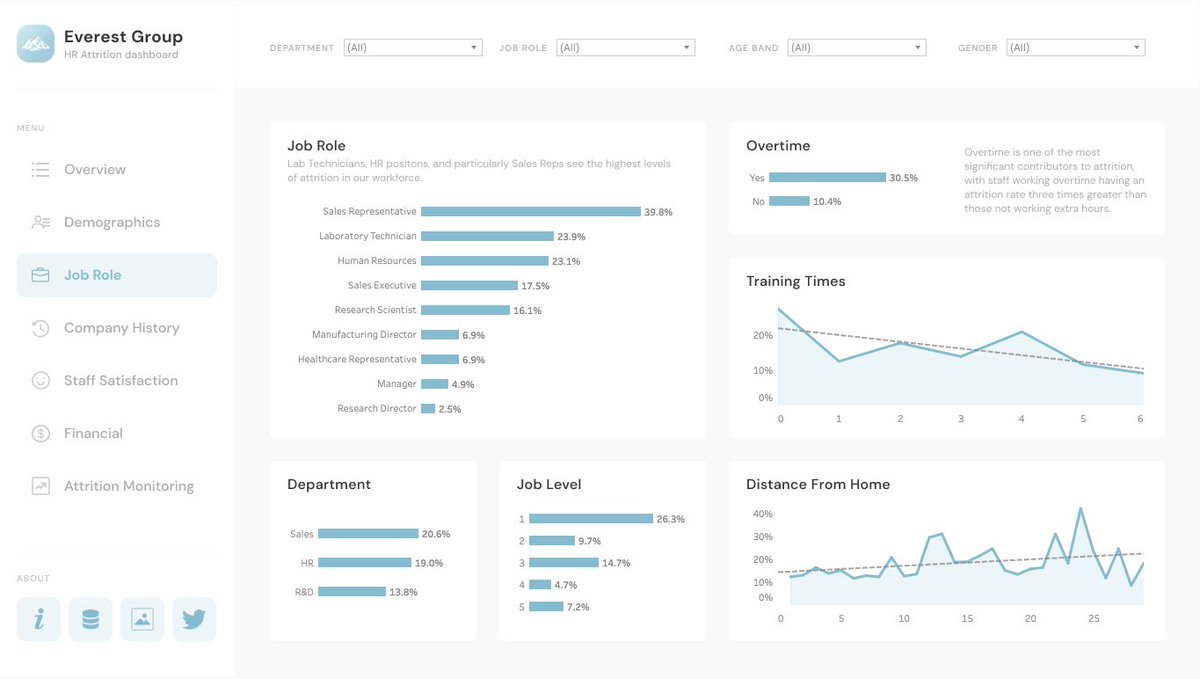
Here's my first #RWFD dashboard, and it's HR Attrition to kick off season 2! Thanks to @MarkBradbourne for this really fun concept, great chance to get some practice building business dashboards from client requirements.
Link: https://t.co/OHBNs4TNOV
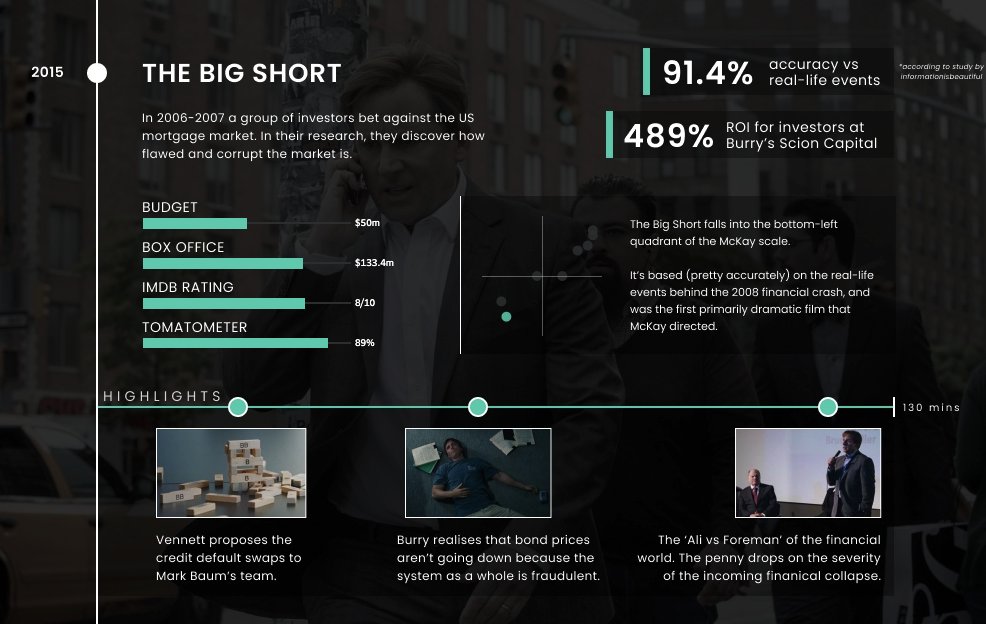
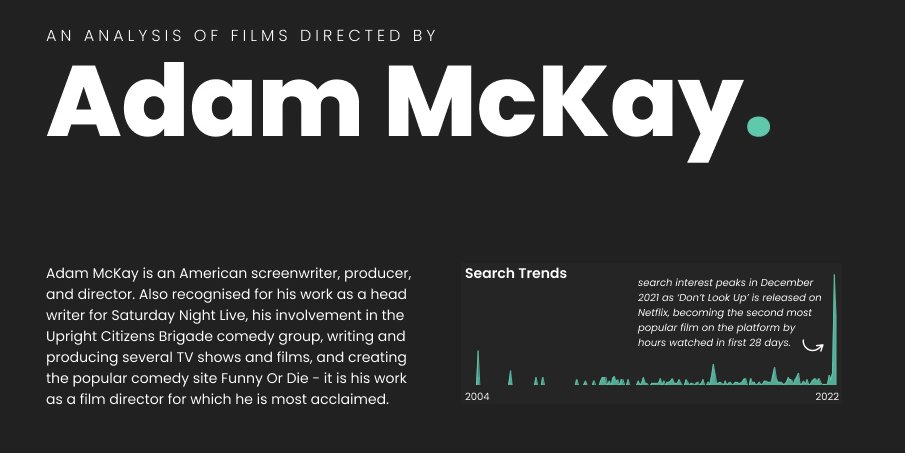
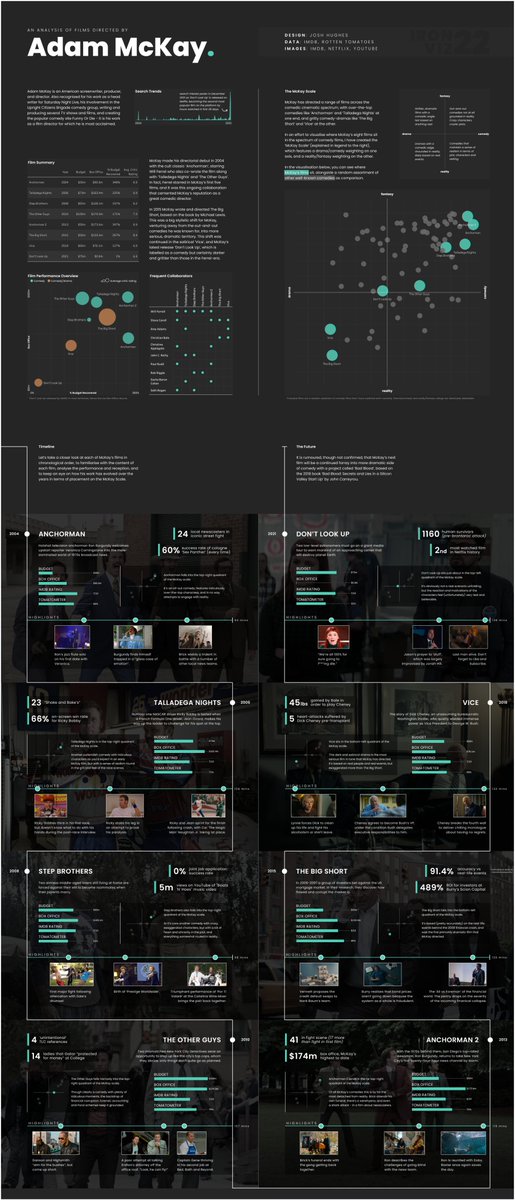
#IronViz 2022 - An Analysis of Films Directed by Adam McKay.
As if I needed an excuse to re-watch some old favourites! Had lots of fun working on this one.
Link: https://t.co/pMjOTEDRsL
@KoesslerTheo@tableau Love this! Insane numbers from Russ, and this a great way to visualise it. Crazy to think he only had 8 triple doubles in his first six seasons
Looking at the varying cost of data around the world for this week's #MakeoverMonday. Inspired by the several other beeswarm submissions!
Link: https://t.co/cCexzG7mTV
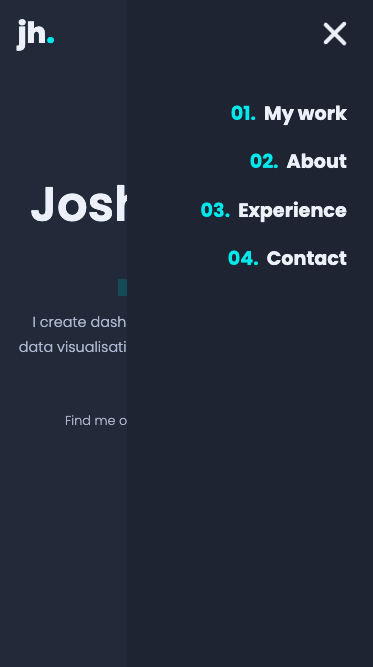
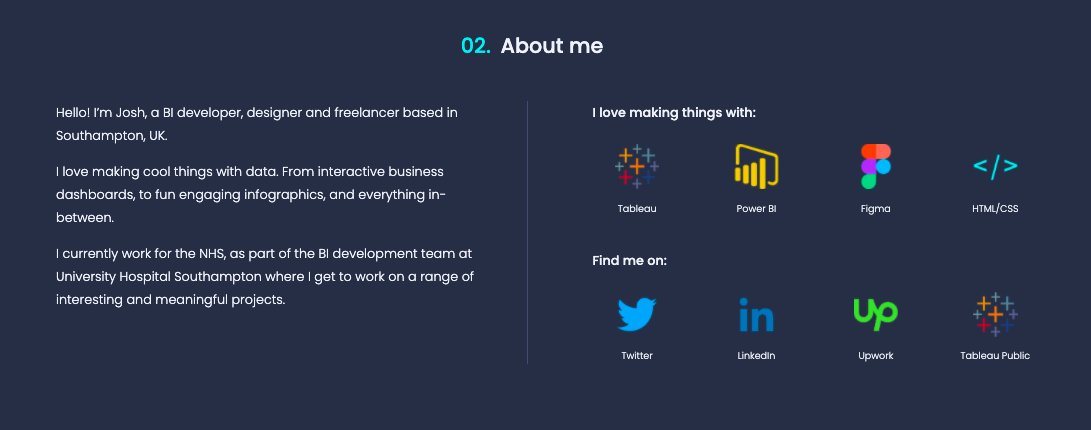
NEW PORTFOLIO!
#Datafam! Here's a project I've been working on to refresh my web dev skills. Nothing super fancy (tried to keep it simple!), but all vanilla HTML & CSS, custom coded from the ground up.
https://t.co/RoUEVe3ypt
1/4
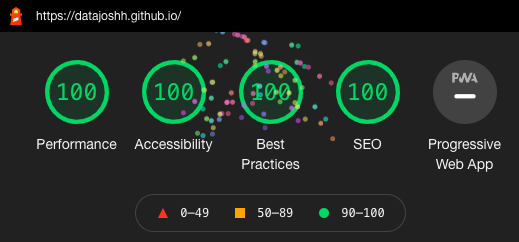
One perk of custom coding everything is the lightning quick speeds, and it's actually the first time I've been able to get a perfect score in the Chrome Lighthouse tests! 💯
4/4
Note - it's much quicker to use Wordpress or Webflow (or at least a CSS framework!) for web projects, but I do think it was a fun challenge to get back to basics and code everything from scratch. Would def recommend if you're wanting to improve your HTML and CSS skills!
3/4
@ZenDollData@tableaupublic No way! That's prompted a very interesting little Google search 😂 who'd have thought Philly was the place to be for mushrooms! Will keep this completely random fact tucked away for future pub quizzes! 🍄🍄🍄