Data extraction & web scraping for Food Delivery, Travel, E-commerce, and Hospitality. Turning complex data into actionable insights.
Trusted Data Compliant!
Hello, X! We’re Datanitial — your data extraction partner.
We help businesses extract, process & transform online data into actionable insights.
Here’s what we do & how we can help you. 🧵👇
Same hotel, same dates, different screen.
During peak weeks, 31% of tracked OTA searches showed different mobile-app and desktop prices, up from 18% in normal weeks.
App rates were usually lower by a median 7%.
#TravelIntelligence#Datanitial
Peak-week cancellations and refunds rose from 2.1% to 5.8% of orders across tracked delivery-first restaurants, costing 3.4% of peak-week revenue.
Track losses by outlet, platform and hour.
#RestaurantIntelligence#Datanitial
Products gaining 50+ ratings in peak festive week ranked 5 positions higher the following month than comparable products with fewer than 10.
Peak week can build more than sales it can build review momentum.
#Qcommerce#Datanitial
Hotel flexibility costs more at peak. For the same room types, the flexible-rate premium averaged 12% in a normal week and 24% on peak holiday dates.
Compare cancellation terms not just the lowest rate.
#HotelPricing#TravelIntelligence#Datanitial
The week after the festive peak, orders fell 22% below pre-festive baseline while ad CPC dropped 30% from peak levels.
Plan to win orders when visibility costs less.
#RestaurantIntelligence#Datanitial
Two snack brands hit ~30% share of search during festive peak.
Two weeks later, one held 26%; the other fell to 12%.
Organic visibility retained 75% of peak-week gains vs. 15% for sponsored-led gains.
#Qcommerce#Datanitial
9 days.
That's how long a quick-commerce SKU out of stock for 6+ hours in peak festive week took, on average, to win back its search position.
A short stock-out. A long way back.
#Qcommerce#DataIntelligence#RetailTech#ZeptoData#Datanitial
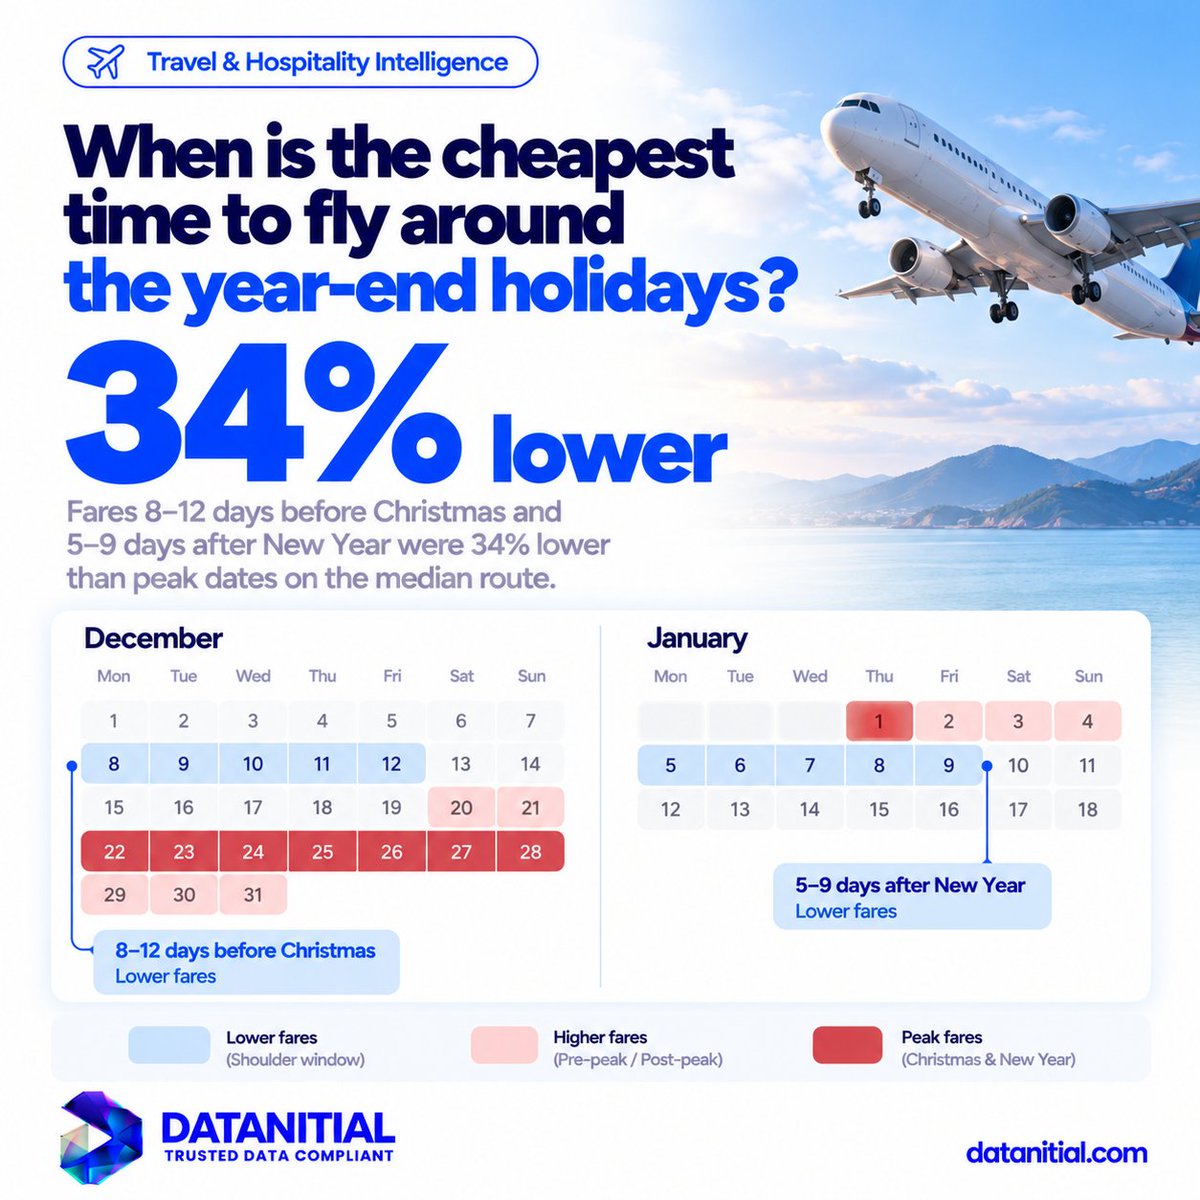
Flying around Christmas and New Year?
Shoulder dates may be the smarter bet.
Fares 8–12 days before Christmas and returns 5–9 days after New Year were 34% below peak dates on the median route. #TravelIntelligence#Datanitial
Festive specials on one delivery app, missing on another? That’s a distribution decision.
38% of restaurants tracked listed festive items on only one major app.
Those on both saw 21% more festive-item orders.
#FandB#Datanitial
Does a faster delivery promise lift search visibility?
Products appeared on the first screen 1.6x more often in zones showing delivery in 10 minutes or less vs. 20+ minutes.
#Qcommerce#Datanitial
Last-minute holiday availability doesn't mean bargains. In leisure markets, 63% of remaining rooms were premium categories, and the cheapest bookable rate averaged 2.4x its level 30 days earlier.
#HotelRateIntelligence#Datanitial
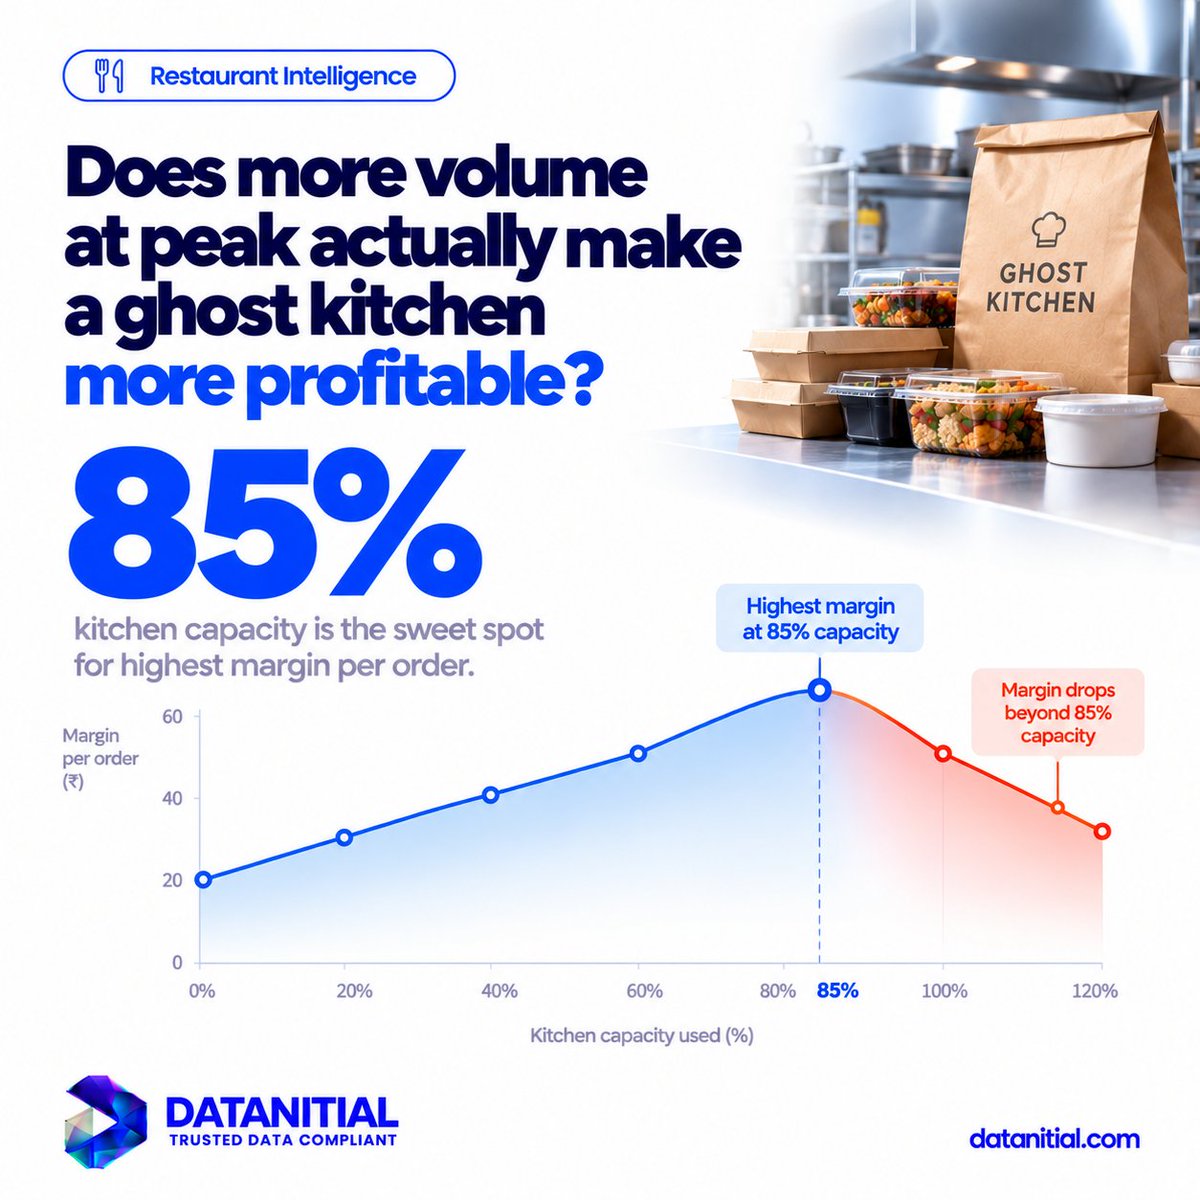
Does more peak volume mean more profit? Ghost kitchens saw contribution margin per order improve up to ~85% capacity, then fall by 4 percentage points beyond it.
#RestaurantIntelligence#FestiveMargins#Datanitial
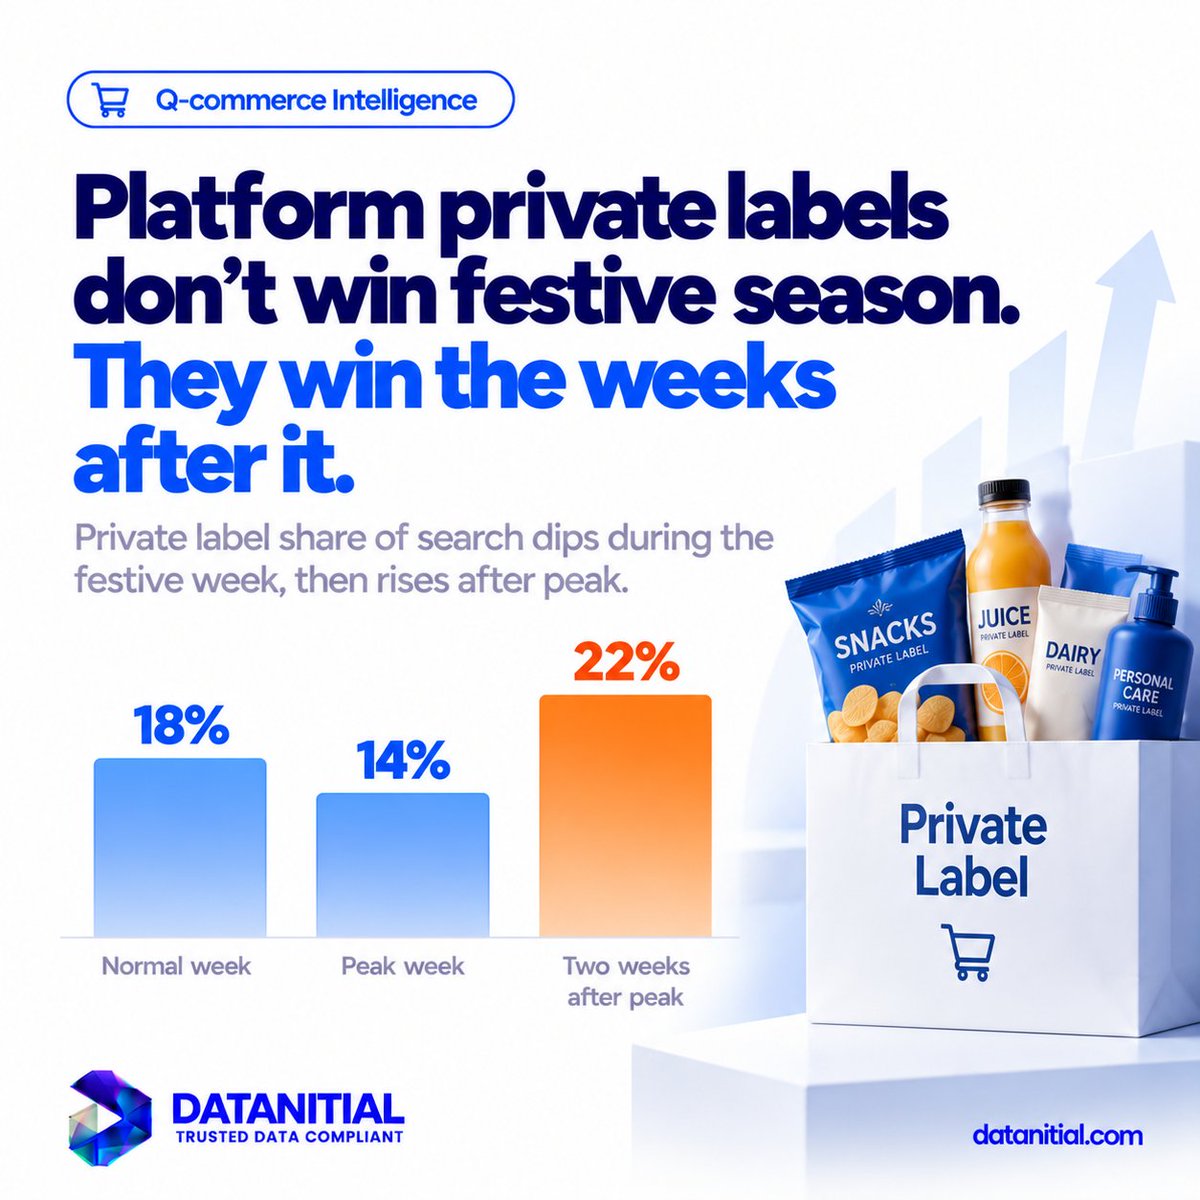
Platform private labels lost share during festive peak but surged after. Share of search fell from 18% to 14%, then climbed to 22% in the following two weeks.
#Qcommerce#ShareOfSearch#Datanitial
When does a holiday package beat separate bookings?
On peak dates, packages were cheaper in 58% of 200 tracked itineraries, versus 41% in a normal week.
#TravelIntelligence#PeakSeasonPricing#Datanitial
For sweets and desserts, festive demand peaks early. Orders peaked 4–6 days before the festival, then fell ~30% on the day itself.
Mains and party food peaked on the day.
#RestaurantIntelligence#Datanitial
148 new SKUs entered one quick-commerce snack category in the 6 weeks before festive peak 3x the normal launch rate.
Nearly 40% were gift packs, bundles or festive editions.
#Qcommerce#Datanitial
A hotel's headline rate may look fair until checkout. Mandatory fees averaged 14% of room rates in peak week, and 27% of resort listings revealed them only at the final step.
#HotelRateIntelligence#Datanitial
Peak festive week pushed restaurant ad cost per click up 41% vs. September. Meanwhile, ad-driven orders per unit of spend fell roughly 25%. More spend didn't mean more efficiency.
#RestaurantIntelligence#Datanitial
Does discounting buy lasting search visibility? SKUs cutting prices by 15%+ gained 3 search positions on average but lost almost all of that gain within 4 days of prices returning to normal.
#Qcommerce#Datanitial