New Viz! 🤩🤩
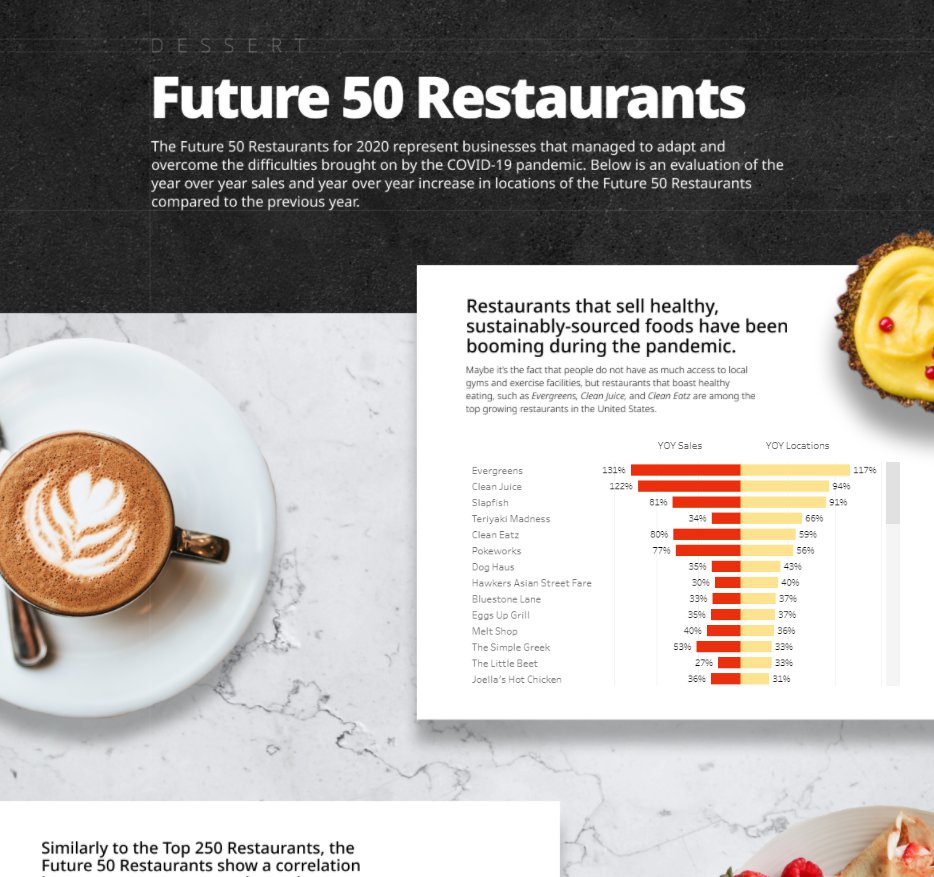
Want to know how the top restaurants performed in 2020? I certainly did. Here is an analysis of the Top 250 restaurants, Independent 100 Restaurants, and Future 50 Restaurants from Restaurant Business Magazine.
Public Link: https://t.co/lixLHgjusq
How, as a visualization designer, will I expect more diverse and sophisticated sandbox functionality in Tableau if it's being further integrated in another platform? Isn't that the whole thesis of Tableau's success?
@Tableau is a tool that empowers its users with both analytical and creative freedom. That's why the #datafam is even a thing. The tool enabled creative expression of design and analytics. Pigeonholing Tableau into a defined role seems opposite of it's sandbox nature.
Welcome to the 2022 Tableau Ambassadors!
Tableau Ambassadors are leaders who help everyone see and understand data—and make the #DataFam a more vibrant and inclusive place for all. https://t.co/JMgimpNgux
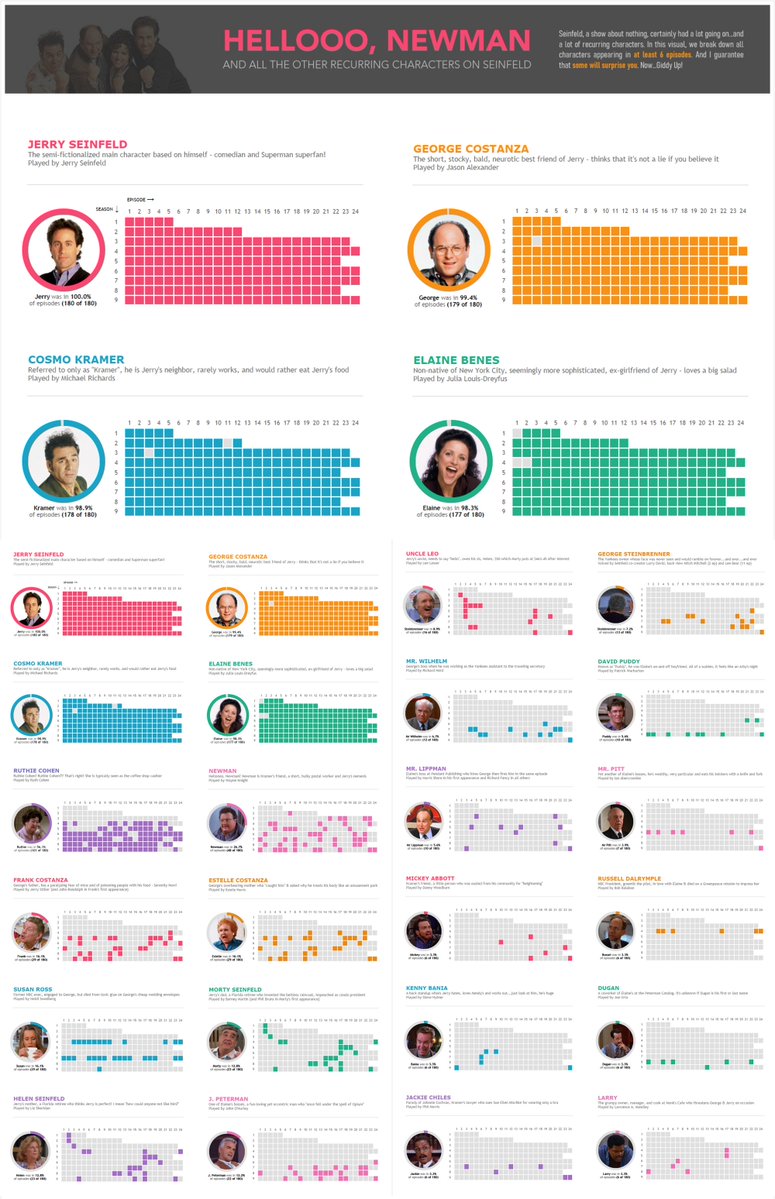
I LOVE the TV show Seinfeld. One day I started looking at the most common, recurring characters and yada yada yada…I made this viz! Giddy up!
Link to Viz: https://t.co/tZqXb0hUOn
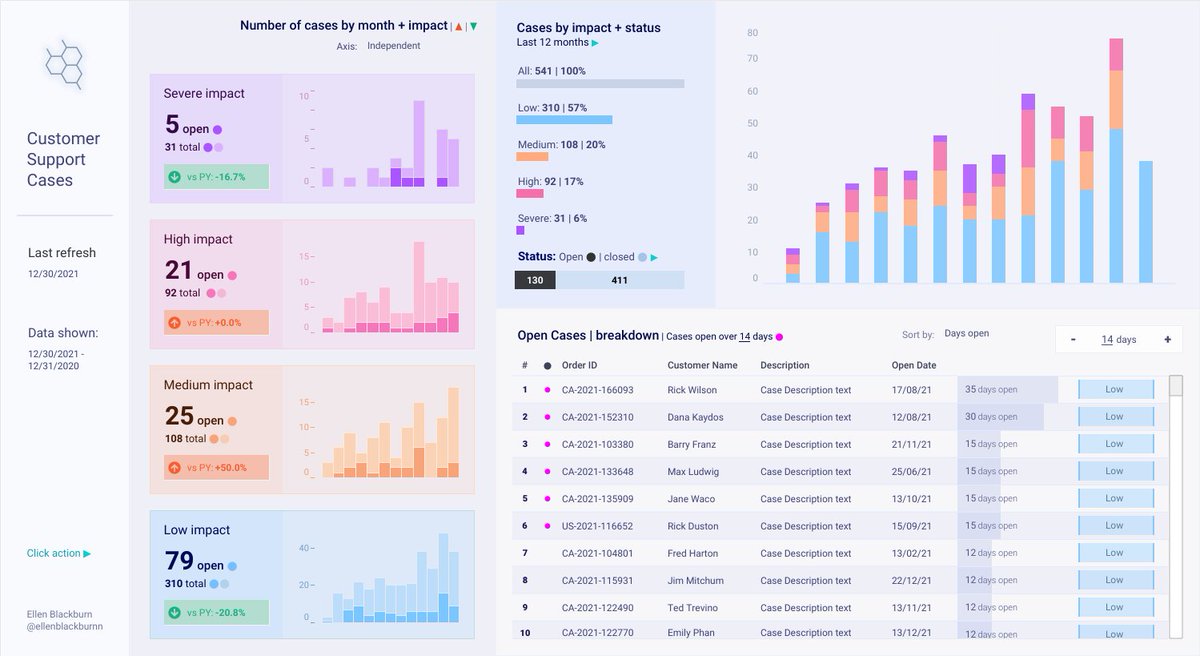
Check out this business dashboard-style #VOTD by @ellenblackburnn who uses stacked bar charts to visualize a demo of customer support cases. https://t.co/MWnF12UvIb
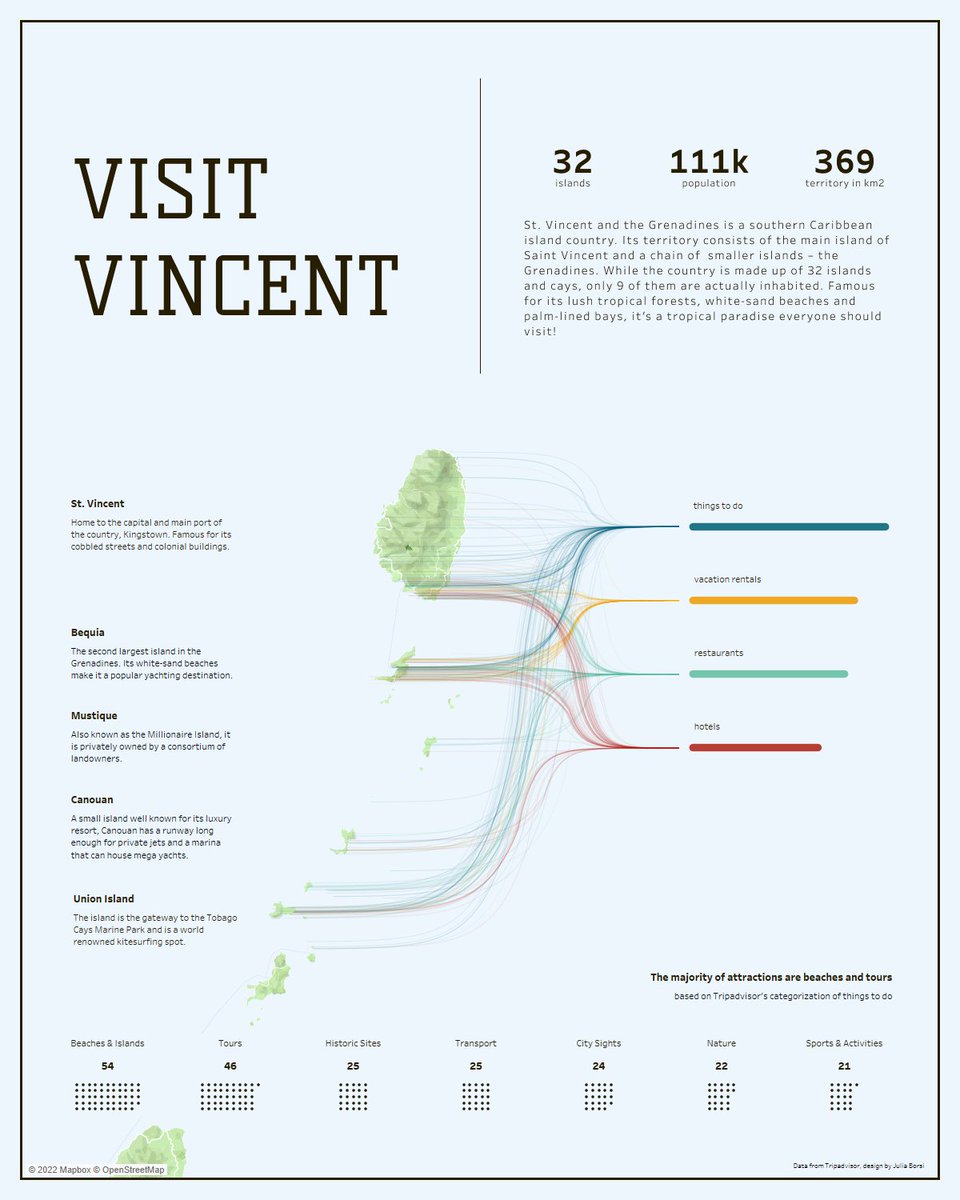
Back in 2020, I spent a few months in the unbelievable St. Vincent and the Grenadines and I fell in love. I wanted to visualize all the attractions and incredible places the country has to offer ever since because I believe that everyone should Visit Vincent! @StvincentGren
Hey #datafam! Want to create cool dashboards for an awesome hospital network? My team is currently hiring! Here is the job position: https://t.co/5ajSF1ImXC
Please PM me if you're interested!
New viz 🚨: The State of Democracy around the World. Explore EIU's Democracy Index with Democracy is at its lowest global standing since 2006 and less than half of the world lives in a democracy. #Democracyindex#DataFam#Tableaupublic
https://t.co/tmIaJHKoLa
📊New Viz
https://t.co/CdqVFPiBaX
My submission for #RWFD from @MarkBradbourne. Remade the Call Center dashboard from the @tableau accelerators on @tableaupublic.
Also, fun personal challenge. Made the whole thing without using color.
What do you think? #dataviz#datafam