Election result maps can appear distorted, since some ridings are much larger than others. Here's a tile map of the 2019 (preliminary) #elxn43 results, using the "mapcan" r package from @andrewmcc___ 👍
@greyhame23@50ShadesofVan Hi Graham,
YBL: 1965-2018
YQQ: 1944-2018
YVR: 1937-2018
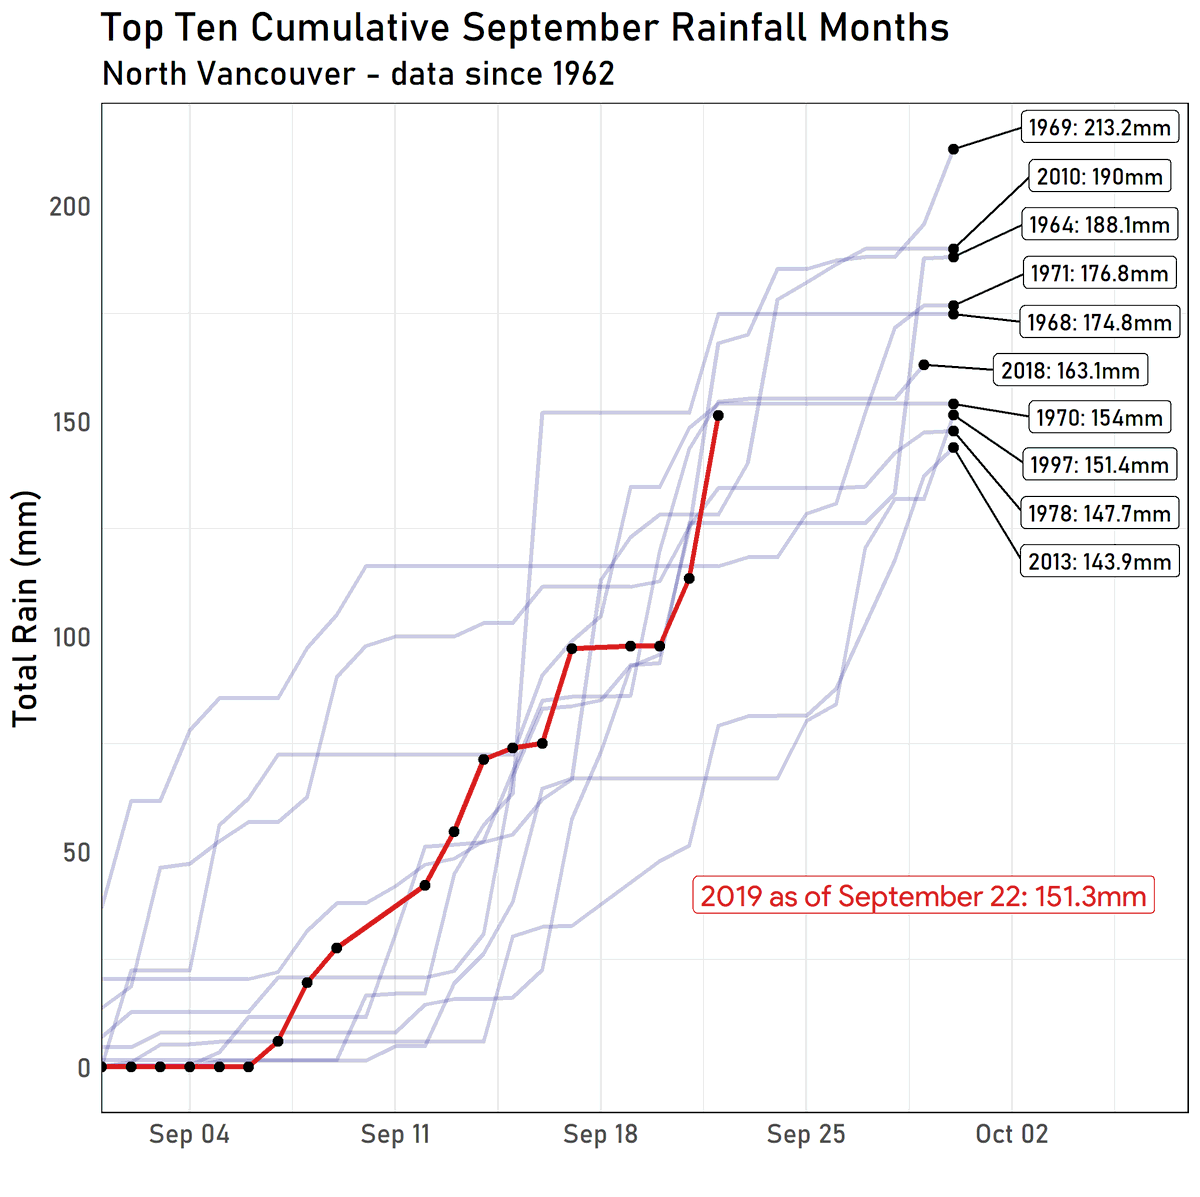
See the chart below. As far as August goes, the rainfall amounts seem to be fairly consistent over time. I have not looked into other summer months.
I've been wanting to make an app like this for a while... It allows you to select a range of pitches and updates the spray chart and stats on the fly. Here's an example for Cody Bellinger. Still needs work but is pretty fun.
This might put the Tofino stat in a better visual perspective, temperature approximately 5 standard deviations above normal for March 19th (CYAZ). This temperature would also beat a couple daily records in the month of June. (Graph: @datawithZ) #BCheat
@darenw Love the idea, tough one to visualize. I like the idea of reversing the order of the frequencies to start. No doubt you'll come up with something beautiful and creative!
VICTORIA, closely watching Friday-Saturday period for a significant snowfall. We're in the midst of the longest lull of snowfall events >10 cm since 1940 (red box), but this could change... #BCstorm#yyj
Arctic blasts from the past, highlighting our recent cold snaps for Victoria and Tofino since 2000. There's a chance Victoria (YYJ) stays below freezing on Monday and Tuesday... @datawithZ@weathernetwork
Canada, we know you love to talk about the weather.
Today, let's join the conversation about mental health.
Be kind, listen and let someone know you're there.
#BellLetsTalk#PelmorexCares