Welcome to Conecty!
This is a preview of our most recent full stack project: A platform for tourist companies who offer exclusive transportation services and reservation of recreational activities to their clients.
#mobilefirst#minimalistdesign#Webdevlopment
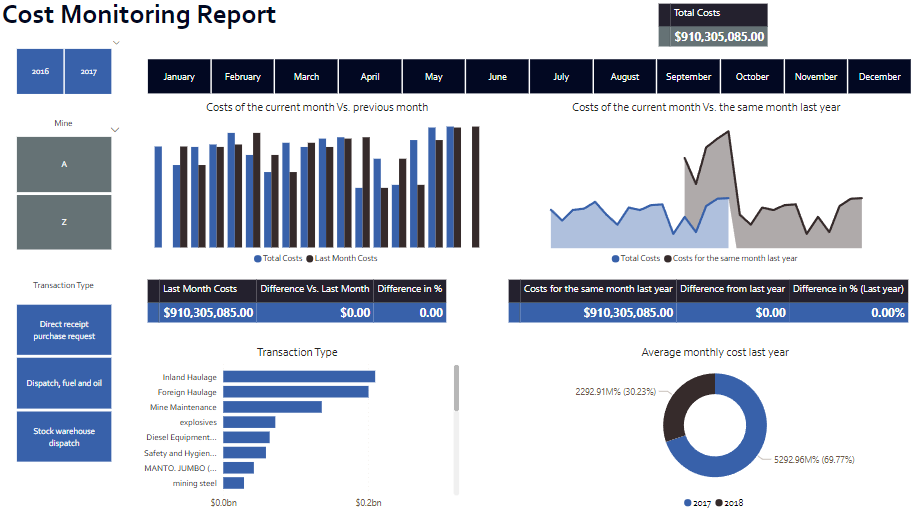
Interactive data visualization in a primary economic sector (Mining).
In this project, our main objective was to compare costs in different periods and show in a practical way their variation over time.
Have fun interacting with this dashboard: https://t.co/L0F49Qo2U6
#bi
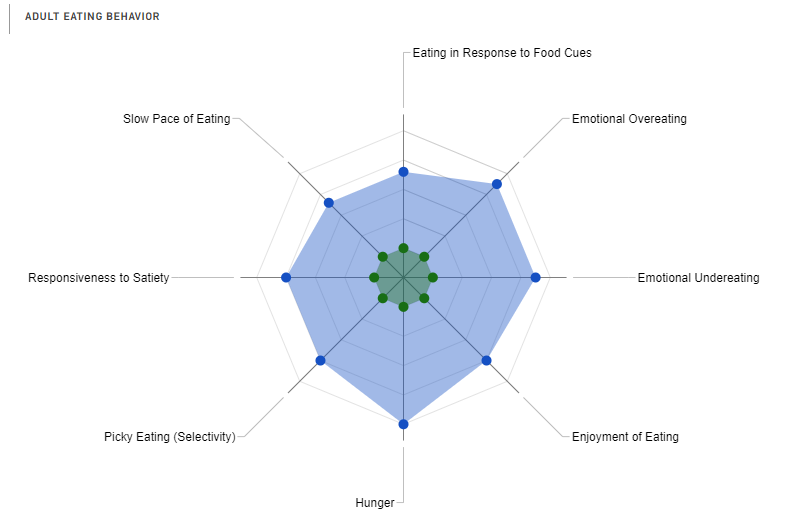
Exploring some data from the Adult Eating Behavior Questionnaire (AEBQ) through a radar chart using the Likert scale. This graph shows eight dimensions of eating behavior, where four of them refer to food intake and the others to non-intake. #Analytics
Since I started research on #weather and #climate, I always wanted to write a global atmospheric circulation model from scratch. Many years later, here we are, proudly presenting SpeedyWeather.jl https://t.co/h9k6Fixjgu written in #JuliaLang and soon in 16/32-bits, on #GPU|s etc