Here is a full breakdown of my EOD swing trading system that:
- Gave me 100%+ years since 2020
- Averages +50% CAGR since 1995 (based on 13k signal database)
- Entering breakouts EOD (2-min before the close),
- and trade 20min/day, with no discretion, and no stress
I will use an example of a trade I closed yesterday in $BMY, following the 5 steps in the pic attached.
---
Step 1:
The first thing to trade momentum breakouts is to find stocks that made a new, fresh leg higher and established a new trend.
I use the 50 EMA cloud (with 0.5 ATR 5 period above and below) as a base, when the market prints a strong first leg coming from this area, it means that it's the FIRST fresh new leg of an intermediate-term trend, and the price/time relationship in the higher time frames has been corrected, and we are EARLY.
It's very important that it's the first leg and fresh; stocks that already had consolidations and are trading in their 3rd and 4th legs of the intermediate trend have a lower chance of having a successful, multi-day breakout.
I've tested this big time, and first consolidations after first legs have a much higher success rate % over later stage consolidations:
-> The later into the trend, the more extended it is, the biggest risk of a stop-out.
---
Step 2:
Then the stock will get in what I call the "perfect uptrend state", which signals when:
• The 8, 20, and 50 EMAs are stacked up and trending, and
• my CML indicator is GREEN (signals a perfect blend of momentum + linearity in a stock, looking at candle overlap for linear moves)
At this point, the stock will be hitting my breadth scans, as we have those stocks in an ABSOLUTE state of momentum, and that's when they give the highest quality consolidations against the 8/20 EMAs to look for a breakout.
---
Step 3:
--> Look for the first valid volatility contraction pattern, riding the 8/20 EMAs layer.
This is the step before the breakout, and you want to see the volatility contract, with the top and bottom trendlines converging together.
This shows that in the case below, sellers are being absorbed, and buyers are about to break through the least amount of resistance, taking prices to major levels quickly.
That's the foundational principle of the volatility contraction/expansion cycle, and we want to find these stocks about to make the expansion leg in the direction of the established momentum (or uptrend).
What to look for in a high-quality consolidation here:
> at least 7 candles of consolidation before a breakout
> no close below the 20 EMA
> see VCP characteristics (mainly a higher low for longs)
> swing points should be defined to draw trendlines OR a horizontal line to trade from ( triangles and ascending triangle shapes only)
---
Step 4:
Now look for the breakout candle, breaking through resistance, and having a nice close.
Some things I want to see here are:
- strong body candle signaling buying into the close
- body of the candle should be bigger than yesterday's candle
- should be closing in upper range of the candle (marked by the 0.786% level most of the times)
- for longs, stop loss size should be <= 2.5x ADR or ATR% for the last 20 days (to keep risk-reward in check)
- Stop goes @ LOD, entering just before the close at 3:58pm EST
---
Step 5:
--> After the breakout, I ride the swing for 5 days, regardless of what happens.
I've tested exits for my momentum breakouts from consolidations with over 13k signals as a database (including my live trades since 2020), and nothing beats a 5-day hold.
I might have different trade management according to my timing model, which is not the scope of this post, but I can have for longs:
- FULL LONGS ( 🟢 light) = exit at the 5th day full position
- LONGS + PARTIALS (🟡 light) = take 40% partial at 1:1 RR, ride the rest until the close of the 5th day.
My timing model is based on lots of breadth-risk parameters, will get into that later on.
---
That's all I do, and I've been doing it for years now. You can check my track record since 2020, and I also manually gathered 10k+ signals in my Strategy Hub App (inside the community), which shows how my strategy performs since 1995.
I trade with hard rules, no discretion, and follow my daily process to scan -> identify -> enter trades in the last 20 min of the trading day.
You do NOT need to be hours in front of the charts, looking for trades, or making emotional, reactive decisions.
You need:
- a strategy
- a daily process
- base it EOD to be done in 20min/day
You can have a life outside trading while still compounding at 50%+ CAGR with low drawdown, which is the whole point of this.
If anything resonates with you, check out my pinned post in my profile with a 4hr+ masterclass on my setup, expanding everything I shared here.
Go and do the work.
You only have to do it once 📈
Biggest focus for the upcoming week will be to see what happens to the semis. $SMH sitting right below the 50ma here. Will be more careful when it comes to new exposure if the semis roll over. Hopefully we can pop above it.
$ALAB, $AMD and $MU all look pretty good. Could be good ways to play the pop if we get it. $MU probably my favorite name in the semi/memory space right now.
Big fan of how $RDW is looking. Has plenty of momentum and is getting supported by the 5EMA. We are also seeing some consolidation which should lead to the next leg up.
$DFNS high flying speculative stock massive ADR and compelling theme. We could get another explosive leg. Note that it is very volatile and the mkt cap is only 60 mil
Weekly/Monthly charts I’m watching into EOY:
$JOBY $DDOG $OPEN $QS
All four are setting up weekly/monthly bases that could offer asymmetrical risk, each building structure right above key moving averages/pivot points and positioning for potential massive monthly breakouts.
This is where I start paying attention.
"the bigger the base, the higher in space" is true.
$JOBY: Building a 5 week base above the 9 week.
Buyers defended every dip, holding that 17 pivot tight. High volume accumulation off the right side of the base... exactly what you want to see when a name’s gearing up for a possible ATH push.
Strong squat off the 9 week + reclaim = strong buying.
Above 17, things can get real quick.
$DDOG: A textbook 4 week base built right off the 9 week. The structure here is butter.
Noticeable accumulation on the right side of the base + failed breakdowns fueling this new trend. This setup screams potential into EOY, a clean push through 200 would confirm my thesis.
$OPEN: First retest of the 9 week since confirming its stage 2 breakout.
Reclaimed IPO VWAP, that’s a massive shift in control from sellers to buyers.
Volume pattern is ideal: spikes on moves up, quiet on pullbacks. That’s institutions building positions.
Above 8 with strength, and it can get rippy fast.
$QS: Down 86% from ATH, now squeezing right at IPO VWAP and 9 week.
This is where new trends start, from forgotten charts and multi-year bases.
High volume off the right side of the base is the signal. I’m long and willing to add to pullbacks within this new stage 2 trend.
All of these names have one thing in common:
Compression at key pivot points.
and we know..
Compression → Expansion
Tight weekly bases above rising EMAs with clean volume patterns are exactly what I look for going into a new momentum phase.
I’m not predicting these moves, but I am preparing for potential in these names.
I’ll use the weekly to identify structure, daily for entry triggers, and ride the wave higher while managing risk the same way I always do.
If you’ve been following me for a while, go through my recent posts, I’ve broken down exactly how I trade these setups step by step.
Take my advice with a grain of salt, because what works for me... might not work for you.
But I will say...
This is the playbook:
Big bases.
Clear structure.
Defined risk.
Repeat the process.
$APLD: bull gap held, bought off the 33 pivot, clear daily support.
Closed small green on the position, not the cushion I wanted. Weekly 34 pivot is big, price is still holding above the 9 day on low volume.
Anything can happen, looking for a push early tomorrow to hold or cut.
$JOBY: are we all watching this $17 pivot? This is textbook.
Compression → Expansion in motion.
Price is sitting right at the weekly 9 EMA + VPOC, with an inside day forming after a squat of the EMAs and reclaim.
This is a setup I’ll take 10/10 times.
It fits my system and risk parameters perfectly, tight range, defined levels, and clear structure.
Your favorite furu doesn’t know which way $JOBY will release… but I have my own opinion.
Let’s see which way this coil releases.
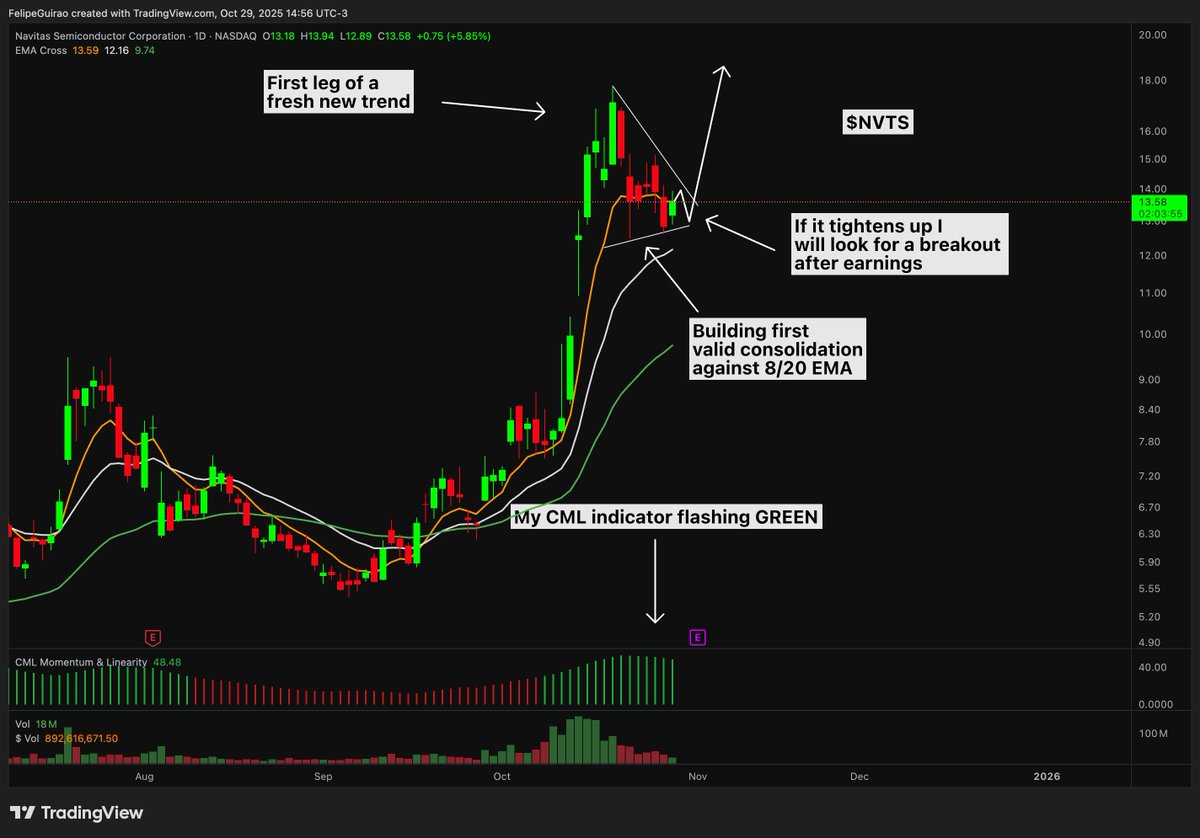
$NVTS
Amazing Semiconductor momentum stock, I've been watching for a while, looks like it's almost ready to go.
The Setup (for now):
- First leg higher of a new, fresh trend
- all 8, 20, and 50 EMAs stacked up and trending
- my CML indicator flashing GREEN
- First valid consolidation almost matured, needs a few days to tighten up and clear earnings
- then look for range expansion through the trendline
Swing trading stocks shouldn't be complex.
All you need is:
1) Momentum, and
2) Volatility contraction/expansion
I've built my edge with just these 2 principles, proven to have an edge for over 100 years in the stock market.
This has given me on average 100%+ returns, with <10% max DD, trading <30 min/day only just before the market closes at 4 pm EST.
Yes, you will have losing trades and losing months. You make money after a SERIES of trades, and the distribution is determined by the market cycle.
That's all I care about. I just:
- Hop on 3:30pm on my computer,
- run my scans looking for signals according to my system,
- enter then at 3:58 pm,
- Set my stop loss, break-even alarm, and come back the next day.
Repeat for days, weeks, months.
After 100s of trades executed, I make above-average returns with minimal drawdown, no discretion, and with hard rules, with 95% of the process automated.
Find and build your edge on durable structure, and you will have something to profit from for the rest of your life 📈
Much of how I view the market can be traced back to @OliverKell_ and his "Cycle of Price Action"
If you’ve studied his work, you know he breaks down the market's cycle into repeating phases.
Each phase is defined by price behavior/structure, moving averages & trader psychology:
I’ve built most of my system around these principles using the 9, 21, and 50 EMAs combined with volume confirmation.
Once you understand this cycle, you can tell whether you should be pressing, protecting, or sitting on your hands, without needing news, opinions of others, or alerts.
I'm going to break down each phase in very simple terms and explain how I've adapted this into my own system:
1. Exhaustion Extension: the End of Euphoria.
This is when the market reaches a point where buying becomes emotional.
Price goes vertical, volume increases, and everyone is chasing. Candle ranges expand far beyond average; the 9 EMA separates sharply from the 21.
Every small pullback is met with blind dip buying.
Psychology: Greed, FOMO, and overconfidence.
Traders feel invincible, right before liquidity starts drying up.
When I see price extended far above the 9/21 EMAs + climactic volume... I start trimming or locking gains.
2. Wedge Drop: the First Crack.
After the climax, the market begins to tighten.
You see overlapping candles, lower highs, and distribution volume.
Momentum slows, yet traders convince themselves it’s a “healthy pullback.”
The 9 EMA starts bending downward; once it breaks decisively, control flips.
Psychology: Denial.
Late buyers defend their entries while stronger hands quietly distribute.
If the 9/21 break and retests fail, I stop looking for adds; this is my system telling me that it’s time to step aside.
3. EMA Crossback: Trend Confirmation.
This is where the technical structure officially shifts.
The short EMAs cross below the 50, turning the tape from bullish to neutral/bearish.
Failed rallies get sold fast; prior leaders lose relative strength.
Volume expands on down days and dries up on bounces.
Psychology: Acceptance and fear.
Traders realize the trend has changed, but hesitate to cut losses.
During this time, I'm not playing offense. I'm looking at defensive positioning (aka smaller size, tighter risk). Avoid catching knives.
4. Base-n-Break: Rebuilding Phase.
Stocks don't go straight up/down forever; every cycle needs a reset.
During this phase, price begins moving sideways, volatility contracts, and volume dries.
The 9/21 flatten and begin curling back up toward the 50.
Institutions quietly accumulate shares.
Psychology: Disbelief.
Most traders are scared from the prior downtrend and ignore the early strength.
What I personally look for:
- Volume drying up near lows
- Tight price action above the 9/21
- Early strength vs. the index (relative strength returning)
When price finally breaks out of the base on expanding volume, that’s your first green light for a new trend.
5. Reversal Extension: Expansion Reborn.
Momentum returns, the start of the next uptrend.
EMAs align 9 > 21 > 50 and spread apart cleanly.
Pullbacks respect the 9 EMA, and volume expands on moves upward.
Sentiment slowly shifts from disbelief → confidence → greed.
Psychology: Optimism.
Strong hands are in control; late shorts scramble to cover.
My execution:
- Add on 9/21 pullbacks within trend.
- Trail profits with the 9 EMA/pivots.
- Hold core until a true exhaustion signal appears again.
but why does this framework matter?
Because most traders chase setups.
But setups live inside these cycles, and without context, you’re guessing which stage you’re in.
Read that again, understand? BARS...
The EMAs give me structure:
- 9 EMA: short-term sentiment
- 21 EMA: trend confirmation
- 50 EMA: "longish-term" structure
- Below 9/21/50 = "slow down & sit on yo bum cuzzo"
and Volume tells me who’s in control.
When volume confirms alignment between price and EMAs, that’s conviction.
Once you can read the cycle...
exhaustion → decline → basing → reversal → expansion, etc... you start to trade with the market.
My core system isn’t about prediction, but it's about context.
Compression leads to expansion.
Structure gives confidence.
and Patience creates edge.
And that, to me, is the real beauty behind @OliverKell_ "Cycle of Price Action".
If you’ve made it this far, here’s what I’d recommend and what I wish someone had told me sooner...
Bookmark this post! and the "Cycle of Price Action".
study it, memorize it, and apply it in your backtesting.
Pull up charts of your favorite tickers and identify where each phase occurred.
You’ll start to notice the same textbook pattern repeating over and over...
exhaustion, decline, basing, reversal, expansion.
The names you trade change, but true human behavior doesn’t.
Once you train your eye to recognize these transitions, you’ll stop forcing trades and start understanding the context behind every move.
That’s when trading truly starts to click.
Thanks for reading till the end! Took me some time to write up this post, so I appreciate the love and all interactions... I hope this gives you a new way to look at the markets.
If you want to study further, I'd recommend @TraderLion and @OliverKell_ as they have great resources!
Best of luck and Godspeed!
I don't think you understand how truly fucked we are...
Imagine 2008 but 10x the leverage, + a housing bubble, a commercial real estate bubble, a private lending bubble and a stock market bubble.
All at the same time...
We are in 1929.