Spent the trading holiday to host something cool for my fellow traders. 🛠️📈
Introducing the Advanced CPR Classification Viewer. It pulls live data, classifies CPR widths (Narrow/Wide/Virgin), and helps spot breakout potential in seconds. It will be a game changer in live market with live signals. Icing on the cake. This site is free to use until further notice. I will keep adding new features
Live site at: https://t.co/uN7K7Gq2SQ
Feedback welcome! building in public. #BuildInPublic #FinTech #Python #NextJS #Traders
PS: Please use for educational purposes. Not a buy or sell recommendation.
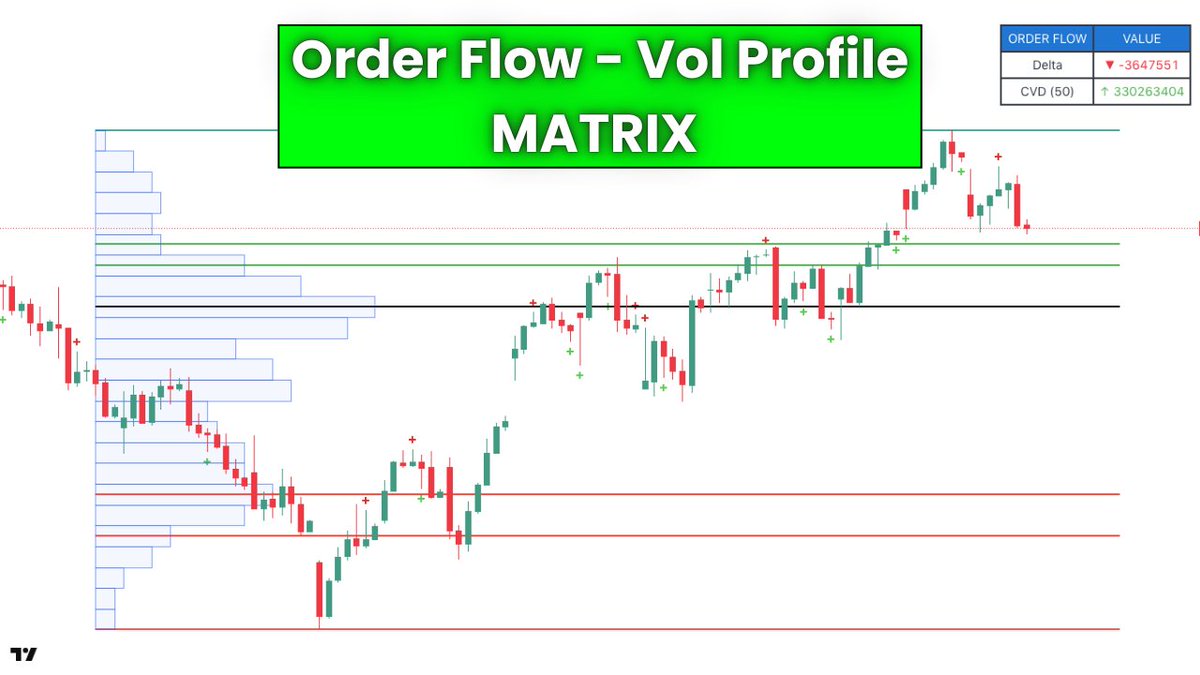
🚨 Order Flow & Vol Profile - Matrix 🚨
✅ Green ‘+’ below a red candle:
More BUY volume than SELL volume (hidden buying or absorption)
✅ Red ‘+’ above a green candle:
More SELL volume than BUY volume (hidden selling or distribution)
✅ Delta:
BUY volume minus SELL volume on the latest candle
✅ CVD (50):
Total of (BUY volume – SELL volume) over the last 50 candles
✅ Black line (POC):
The price level where the highest volume was traded within the selected lookback period
✅ Green lines (VAH 70%, 85%, 100%):
Upper levels where most of the volume got traded
✅ Red lines (VAL 70%, 85%, 100%):
Lower levels where most of the volume got traded
Get this Indicator FREE in just 3 steps:
1️⃣ Follow @OptionsFlavour
2️⃣ Like ❤️ • Repost 🔁 • Comment 💬
3️⃣ DM your TradingView ID
Access will be unlocked within 24 hours.