Welcome to DAWG!
I, @mcbaylor, made this for the college football fans who want to know more than just who won on Saturday.
Why did a team win? Was a game actually as close as the score suggested? Who’s playing better (or worse) than expected? What are we missing when we just look at records and rankings?
We’ve built our own analytics to dig into those questions, with data on all 68 Power 4 teams going back to 2019.
You’ll find weekly rankings, game breakdowns, interesting stats, and deeper stories about what’s happening across college football.
Check it out: https://t.co/oC1fLBR5be
MORE THAN THE SCORE.
Aranda’s Baylor season DAWG rank (of 68 P4 teams):
2020: 47th
2021: T-1st
2022: 42nd
2023: 68th
2024: 11th
2025: 66th
2026: T-20th (thru Wk 8)
The only P4 team since 2019 to finish both first and last.
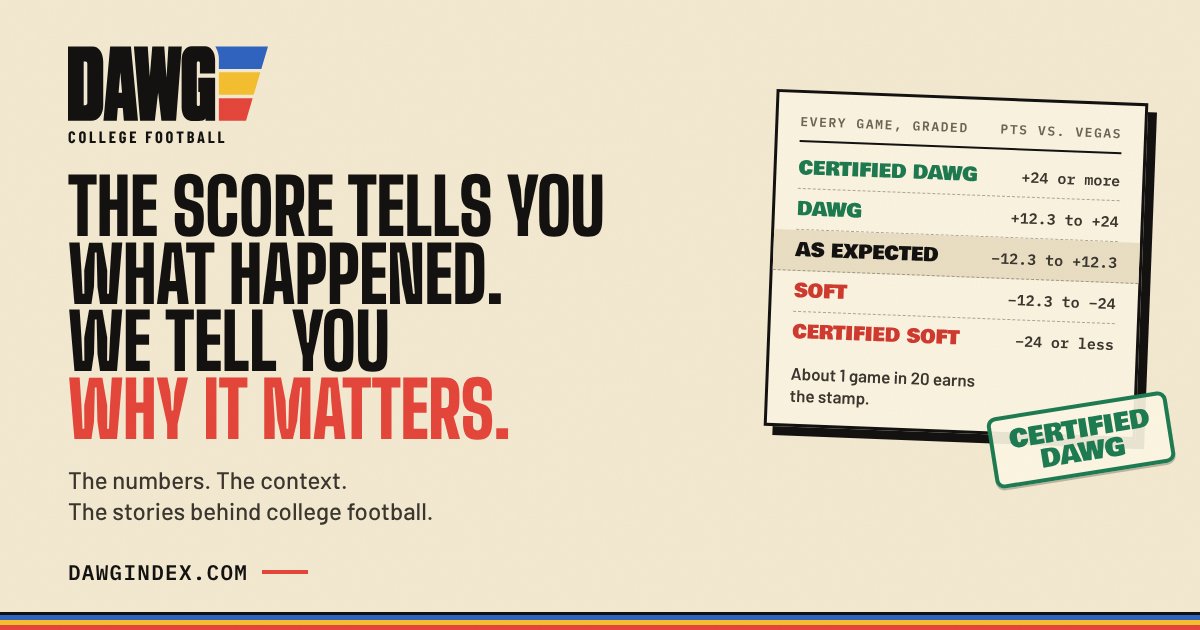
DAWG = how a team performed relative to Vegas' expectations game to game
😈 Wake Forest is still No. 1 in the DAWG 68 after Week 8: +12.2 a game vs. Vegas.
Every Power 4 team, ranked by its average game grade against that week's Vegas line. Not a power ranking.
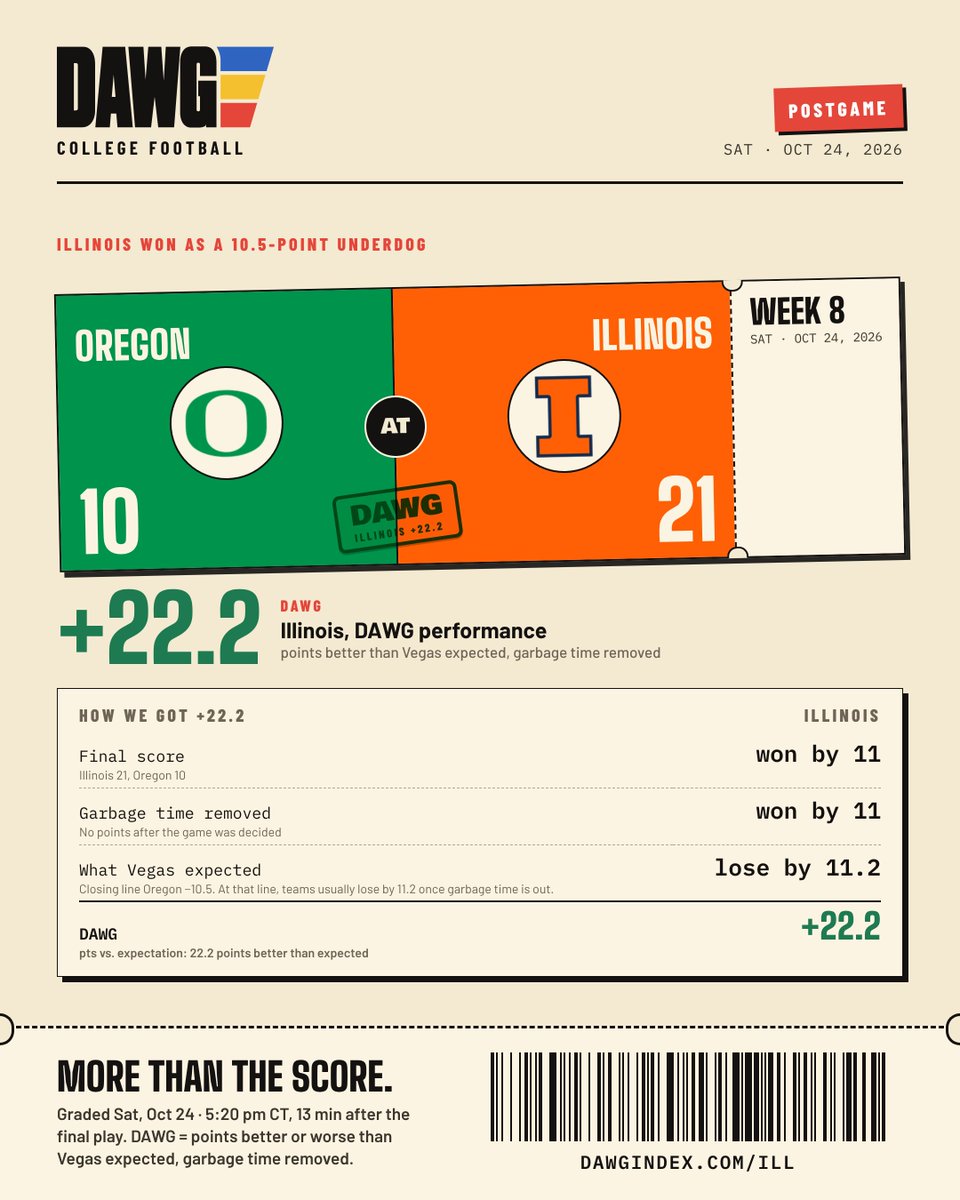
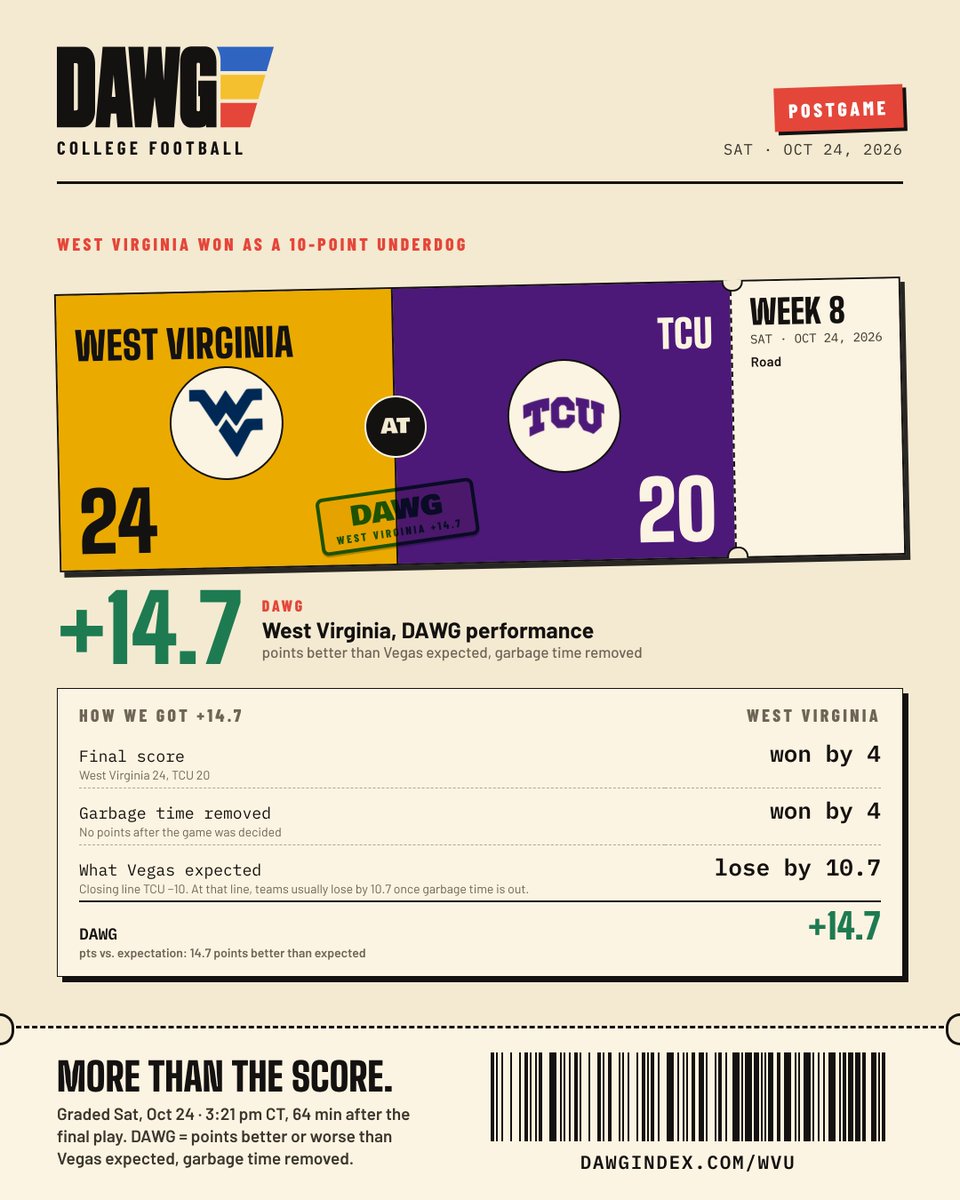
DAWG = points better or worse than Vegas expected, garbage time removed.
Boston College beat Georgia Tech 49-27 and played 29.1 points better than Vegas expected as a 6.5-point underdog.
DAWG grade: +29.1.
DAWG = points better or worse than Vegas expected, garbage time removed.
Cincinnati beat Texas Tech 37-24 and played 24.2 points better than Vegas expected as a 10.5-point underdog.
DAWG grade: +24.2.
DAWG = points better or worse than Vegas expected, garbage time removed.
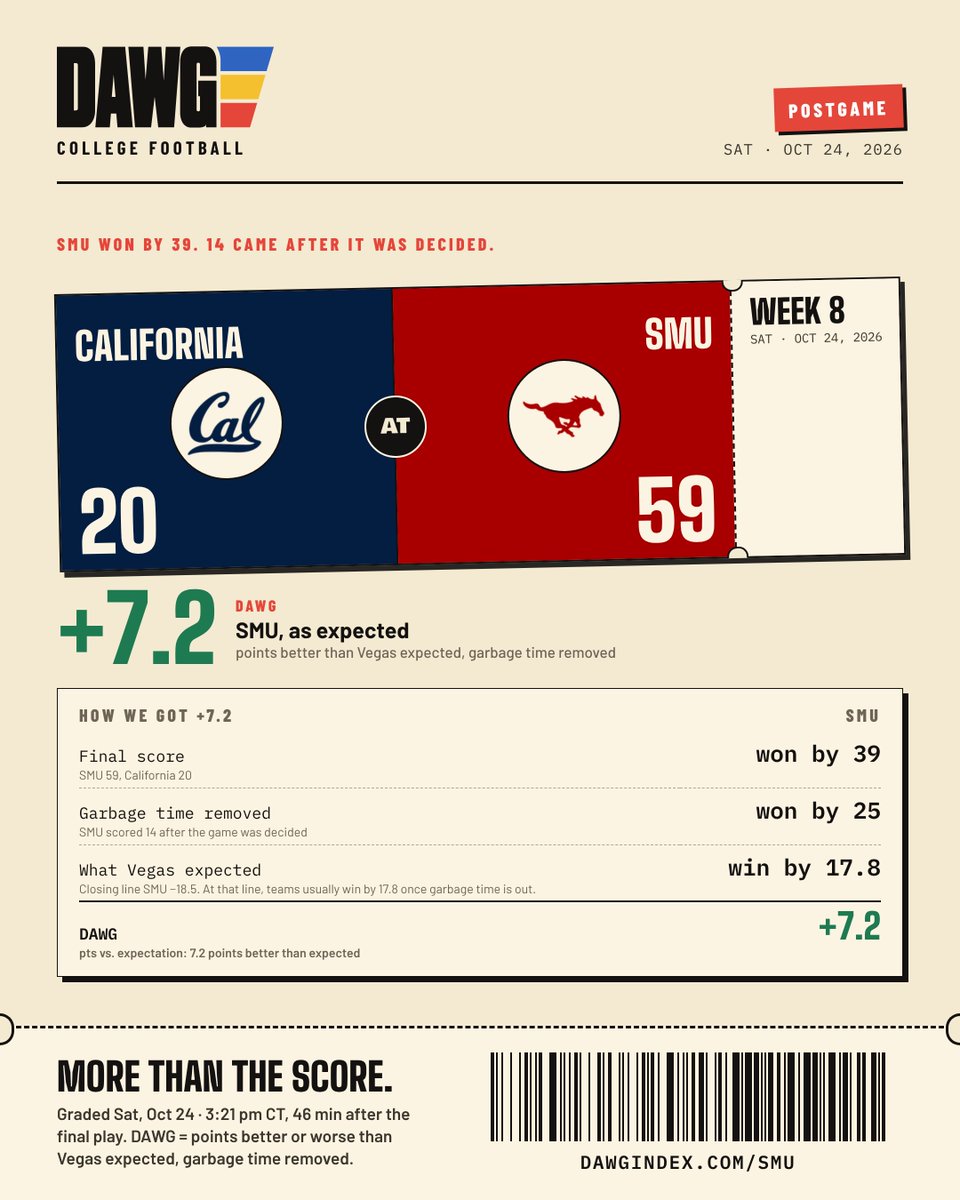
SMU beat California 59-20, but 14 points of the margin came after the game was decided. With garbage time out, SMU won by 25.
DAWG grade: +7.2.
DAWG = points better or worse than Vegas expected, garbage time removed.
🦈 No. 7 Ole Miss visits No. 19 Texas 🤘 on Saturday.
Ole Miss has played 5.4 points per game better than Vegas expected - 8th of 68 Power 4 teams.
Texas has played 4.2 points per game worse - 54th.
Here’s every game for both teams.
Unlike traditional passer rating, this model considers passing, rushing, sacks, turnovers, and the defenses each QB faced.
It also accounts for smaller sample sizes so a few great games don’t automatically put someone at No. 1.
Full rankings: https://t.co/kx4DdMftO7
Two QBs share the top spot in our 2026 Power 4 ratings:
🏈 Conner Weigman - Houston
🏈 Gio Lopez - Wake Forest
Both grade +2.7 points per 30 plays compared with an average Power 4 QB.
Here’s how all 71 qualifying quarterbacks rank through Week 7.
This doesn’t mean an extra week of rest is useless.
It means teams coming off a bye haven’t consistently surprised the betting market.
The numbers, methodology, and more DAWG research:
https://t.co/1ewoUZeWFd
HYPOTHESIS: Does a bye week actually give college football teams an edge?
We examined 671 Power 4 games following a bye since 2019.
Teams performed just 0.3 points better than Vegas expected.
In other words, we found no meaningful advantage beyond what was already expected.
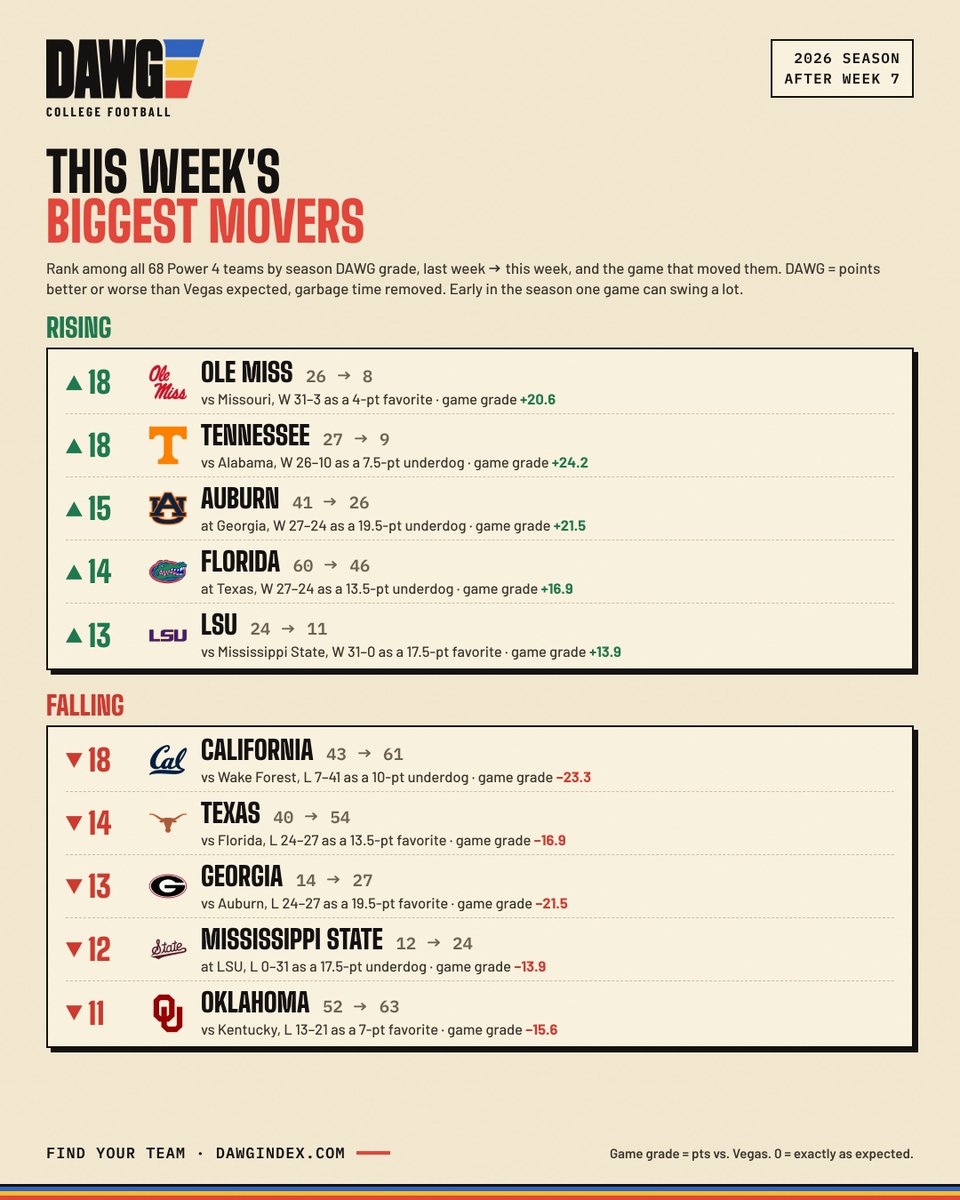
One game can dramatically change a team’s season average!
Tennessee climbed 18 spots in the DAWG ratings after its performance against Bama.
Here are the biggest risers and fallers this week ⬇️
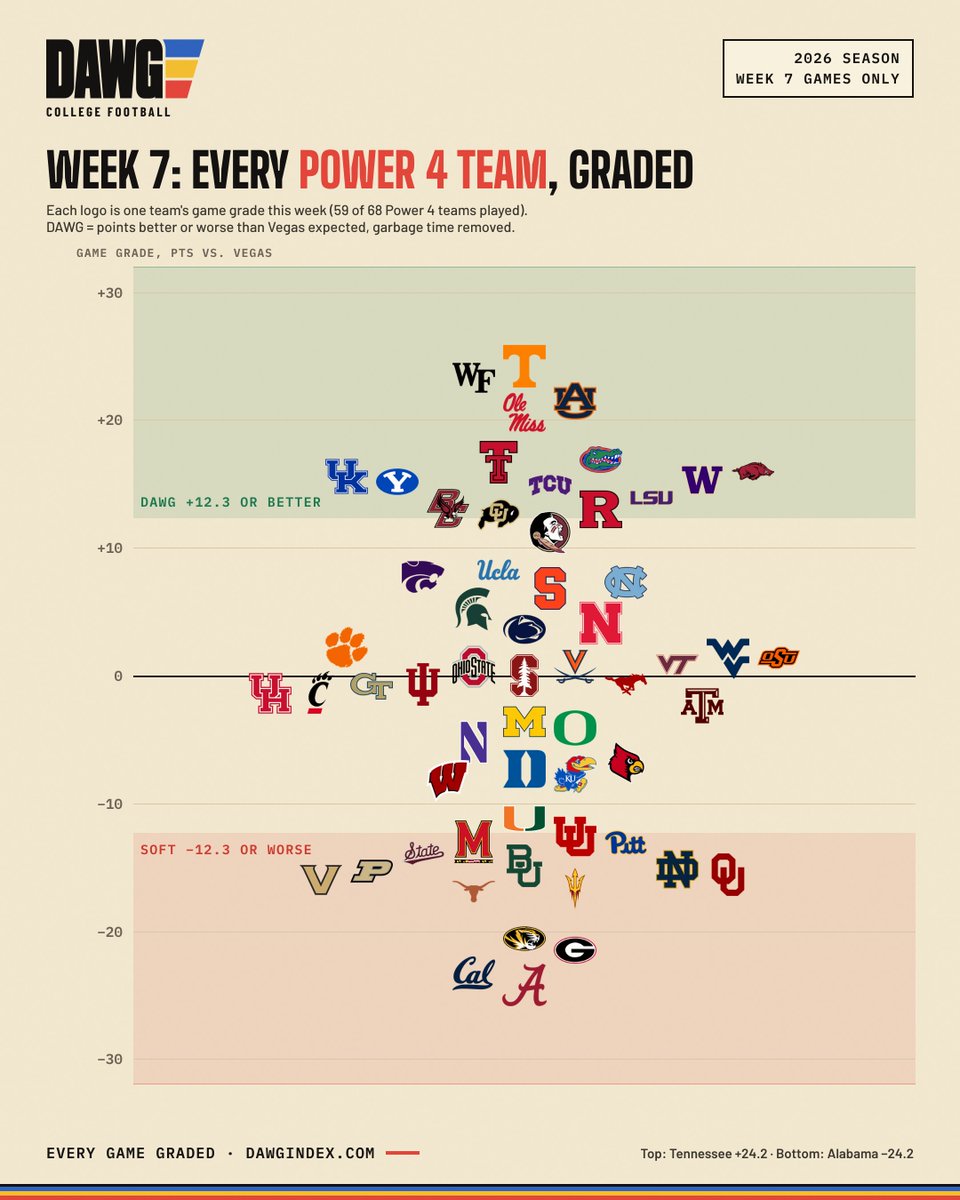
🍊 Tennessee had Week 7’s highest DAWG grade: +24.2 against expectations in its win over No. 6 Alabama.
The Vols entered Saturday as 7.5-point underdogs.
Here’s how every Power 4 team graded this week - and which teams moved most in the season rankings.