Many of my previous outbreak maps, charts and diagrams are available here, along with a listing of all official covid-19 data sources:
🌐https://t.co/NVczFUwkis
COVID-19 Response Inquiry Report
https://t.co/Elv4VgDw4z
COVID-19 Response Inquiry Summary Report: Lessons for the next crisis
https://t.co/06cqP87ZpI
Commonwealth Government COVID-19 Response Inquiry terms of reference
https://t.co/ARxRDpVmfV
📑Final Report: Commonwealth Government COVID-19 Response Inquiry
On 25 October 2024 the Australian Government received the final report from the independent panel appointed to review the response to COVID-19 pandemic.
https://t.co/zXfRaOsRSu
@aparachick@Mike_Honey_ I'm ok, thanks for checking! And apologies for not posting - didn't realise I missed so many weeks, but have been updating the datasets. Life got a bit busy for me with various things so I wasn't near my PC over the weekends.
@ATwnr99034 I see what you mean now, the facility breakdown has the same data. And since the overview is active cases, that would still change if the facility data wasn't updated.
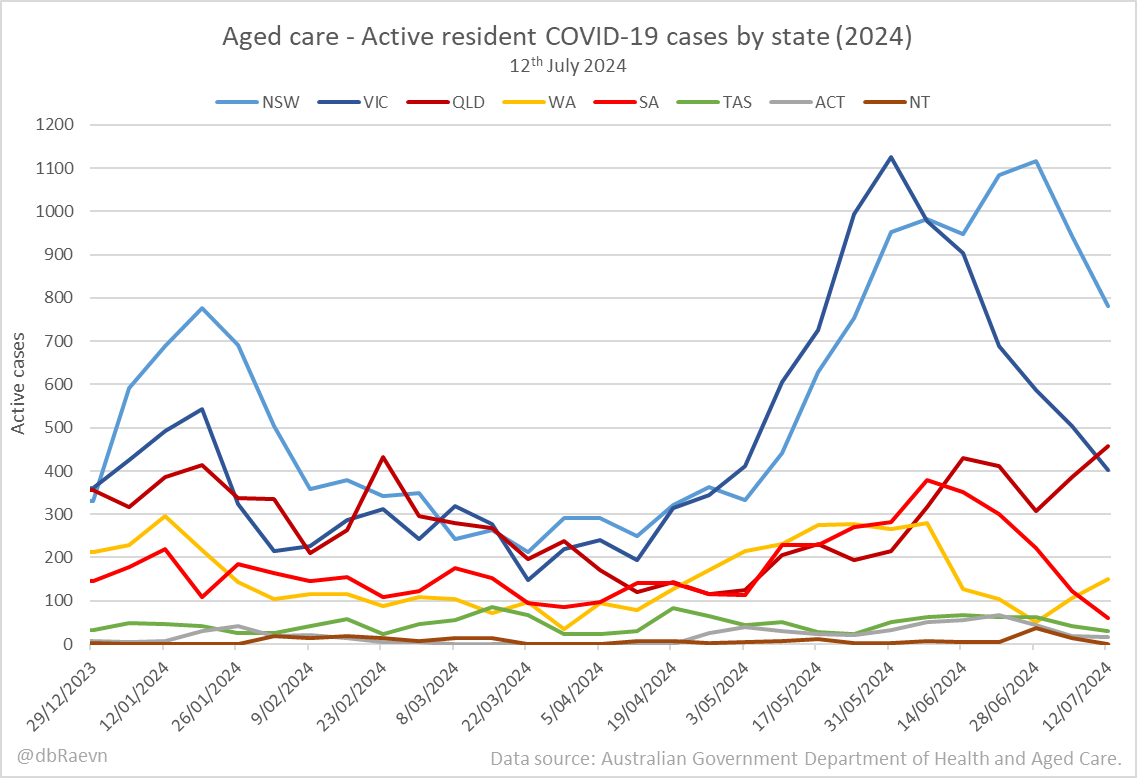
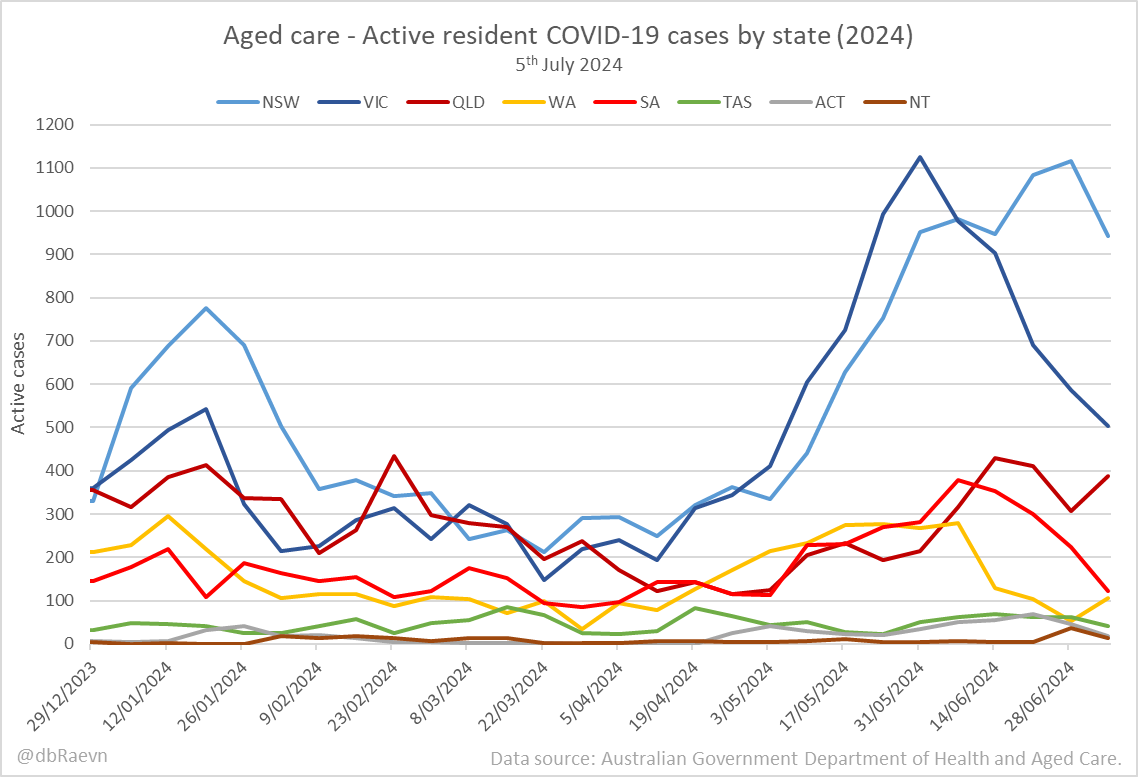
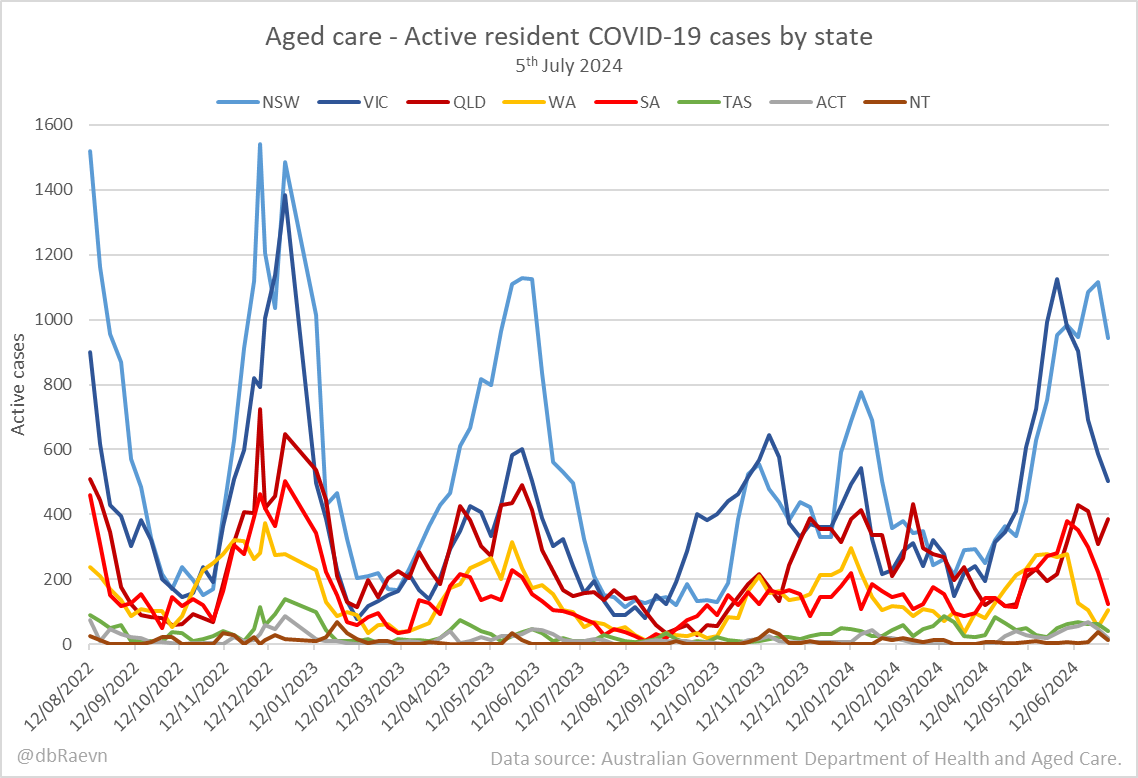
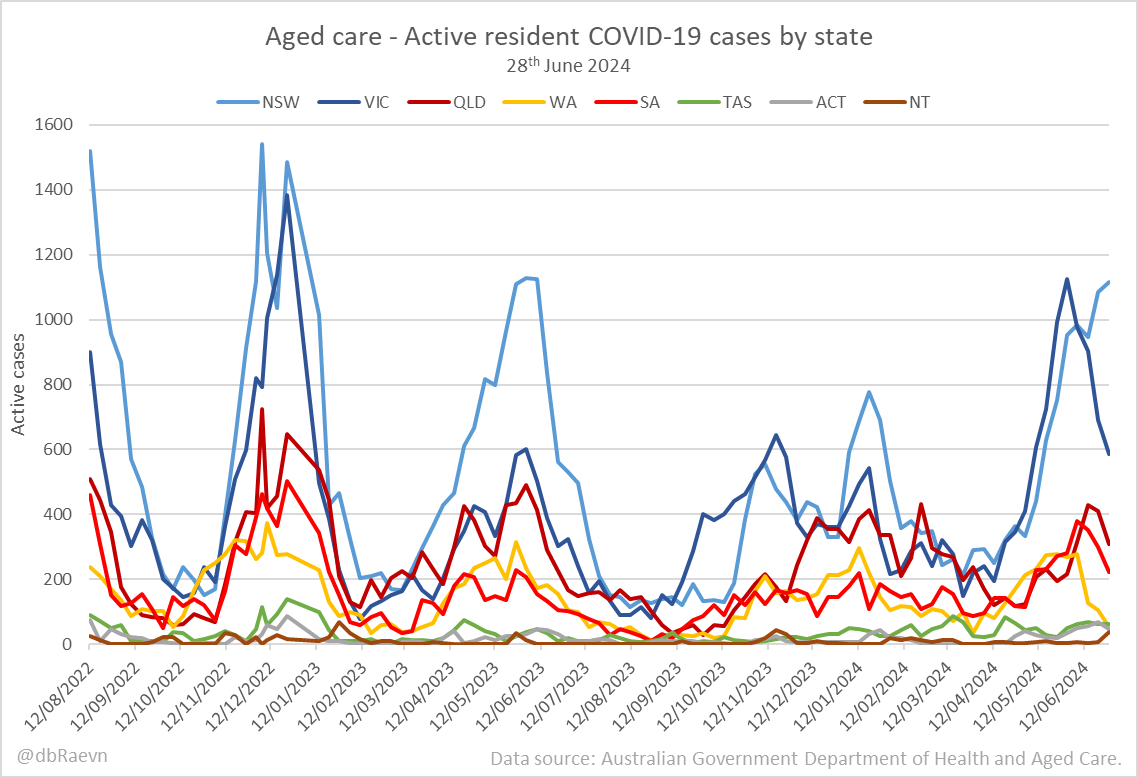
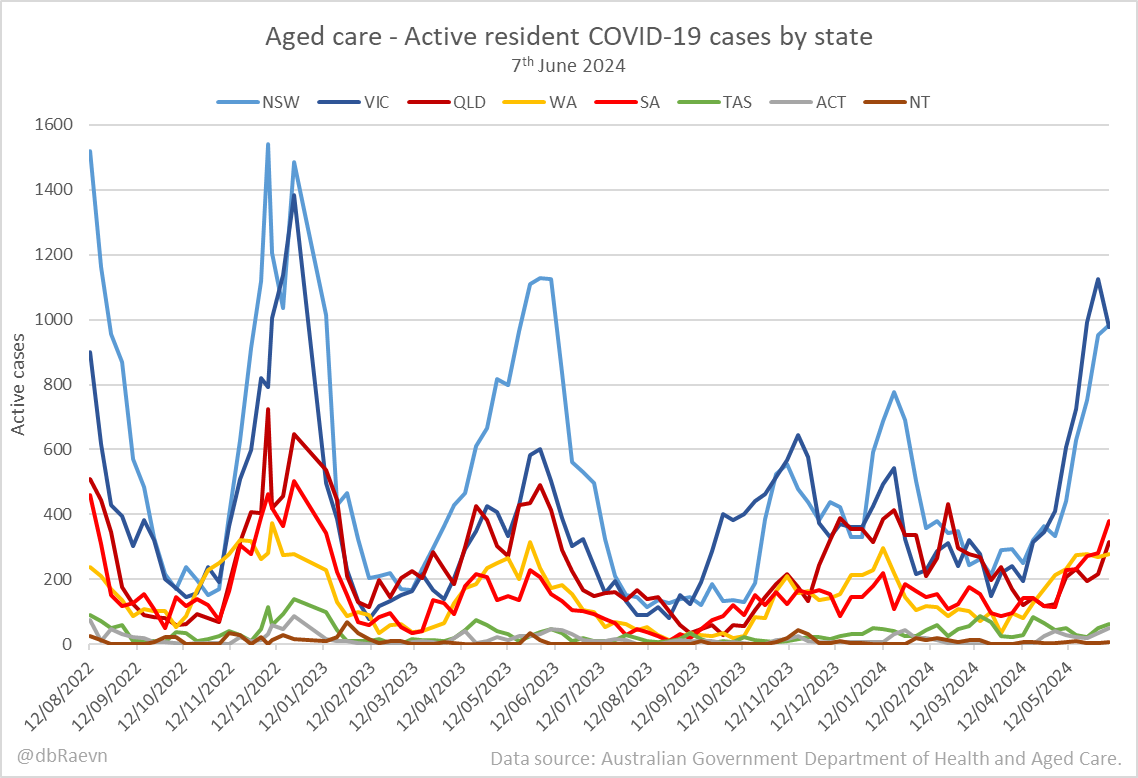
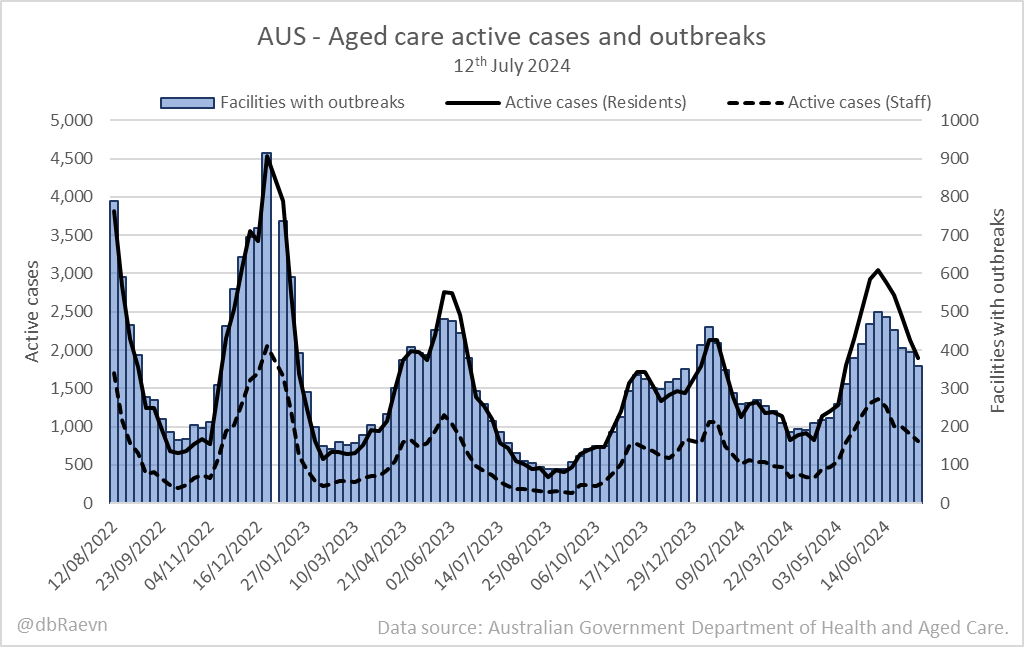
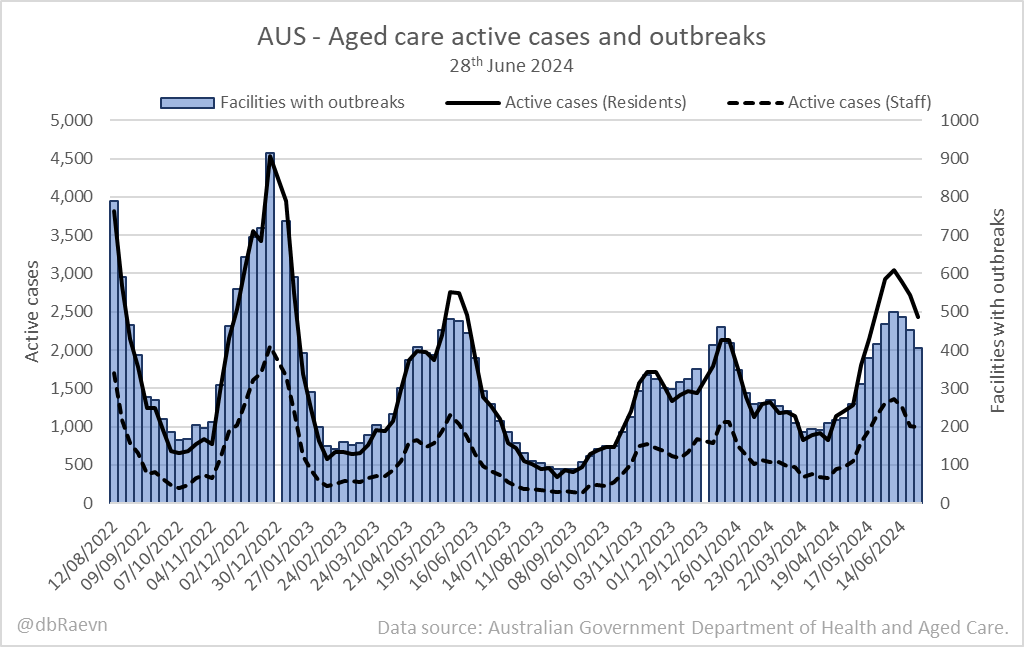
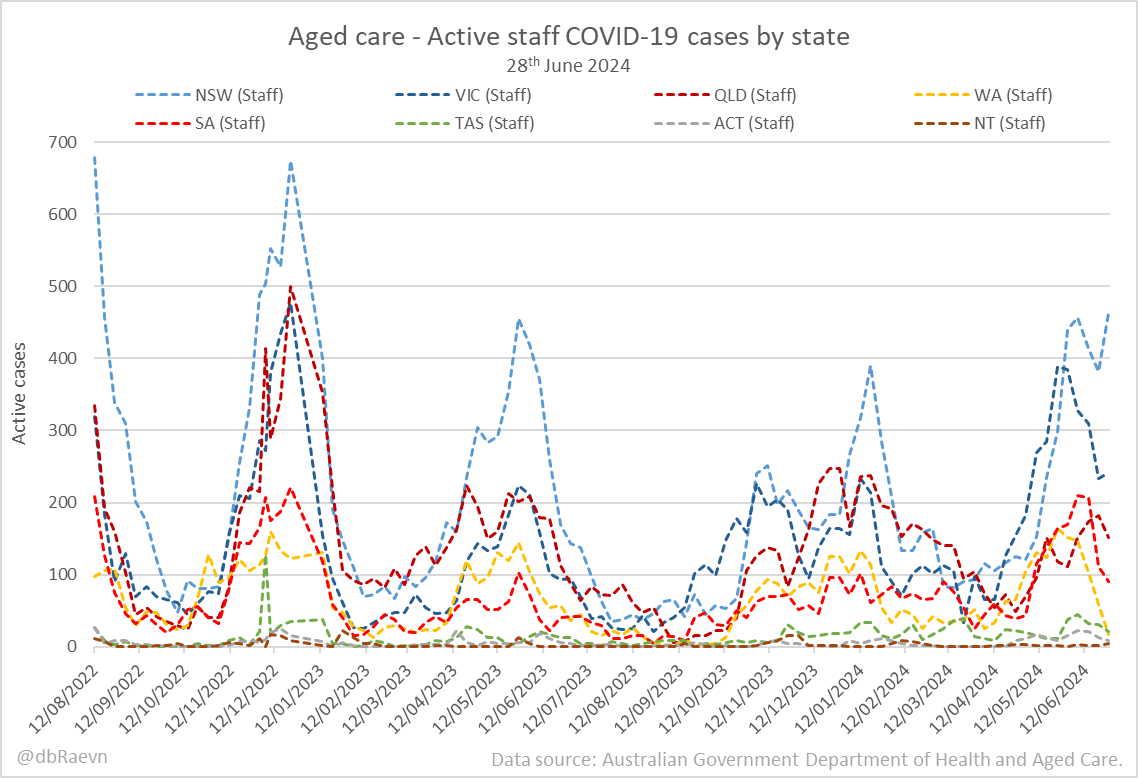
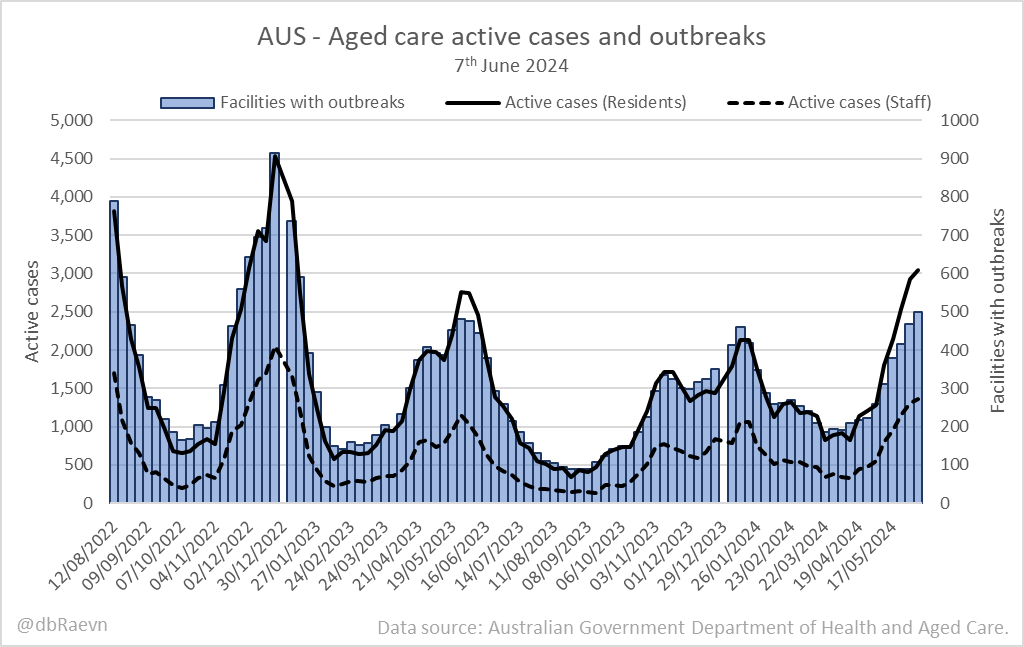
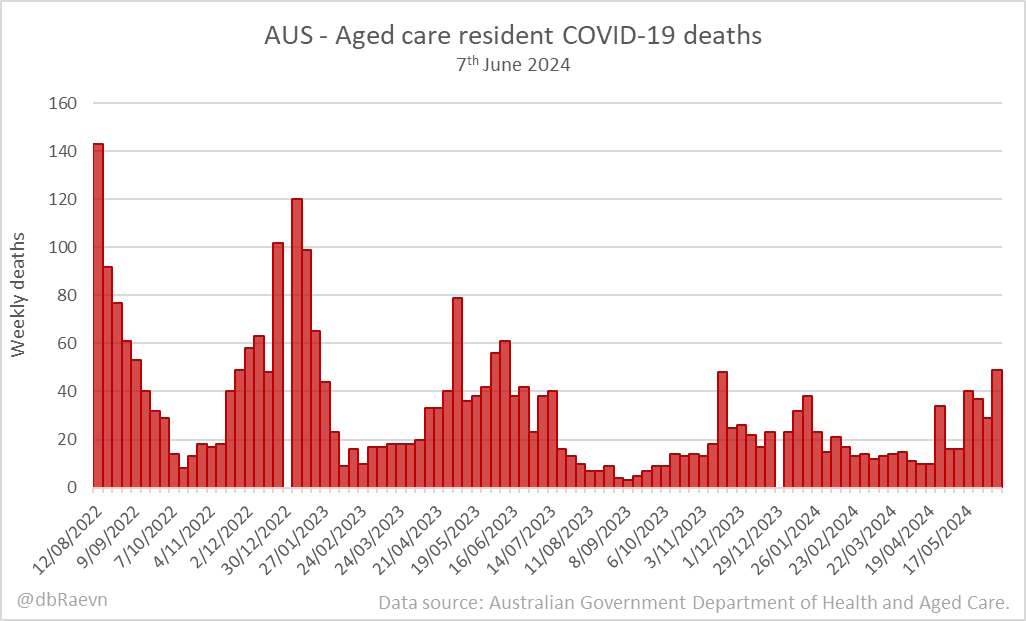
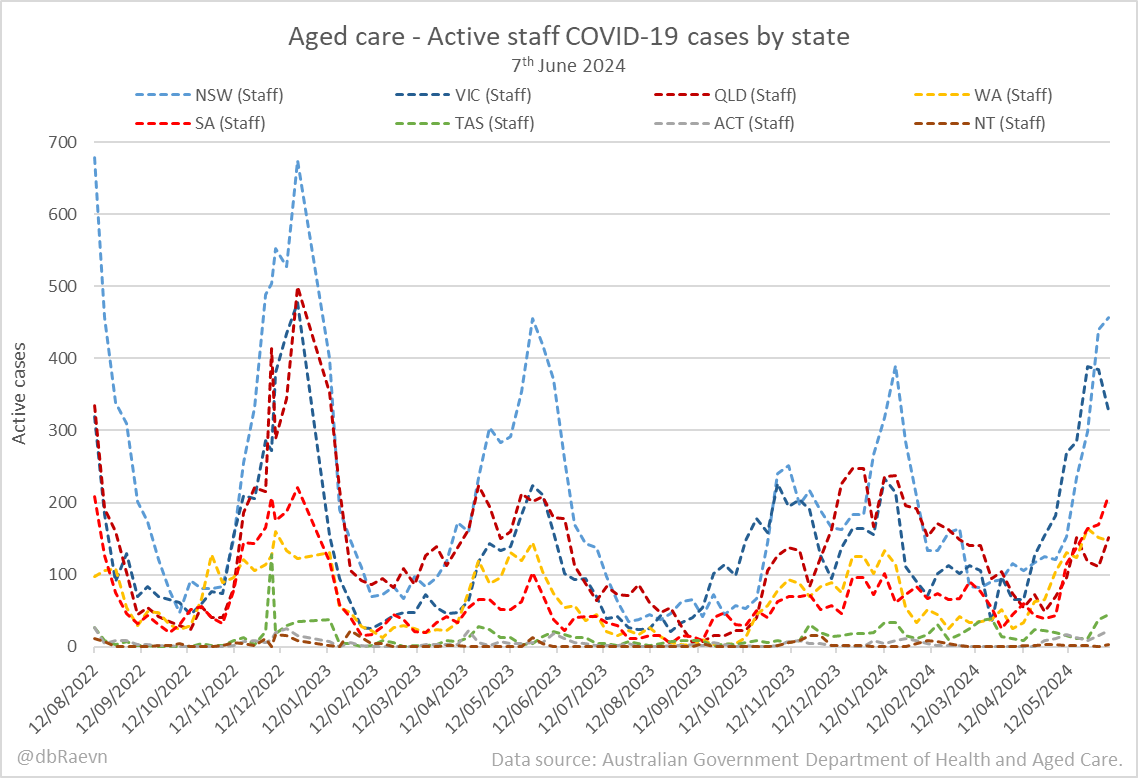
📈AUS - Aged care active cases and outbreaks
7th June 2024
#COVID19Aus
Active cases: 4,413🔺175
• Residents: 3,051🔺124
• Staff: 1,362🔺51
Facilities with outbreaks: 499🔺30
Source: 🌐https://t.co/CvfkvB71b0
Extracted data: 🌐https://t.co/QMQdZmtjpp