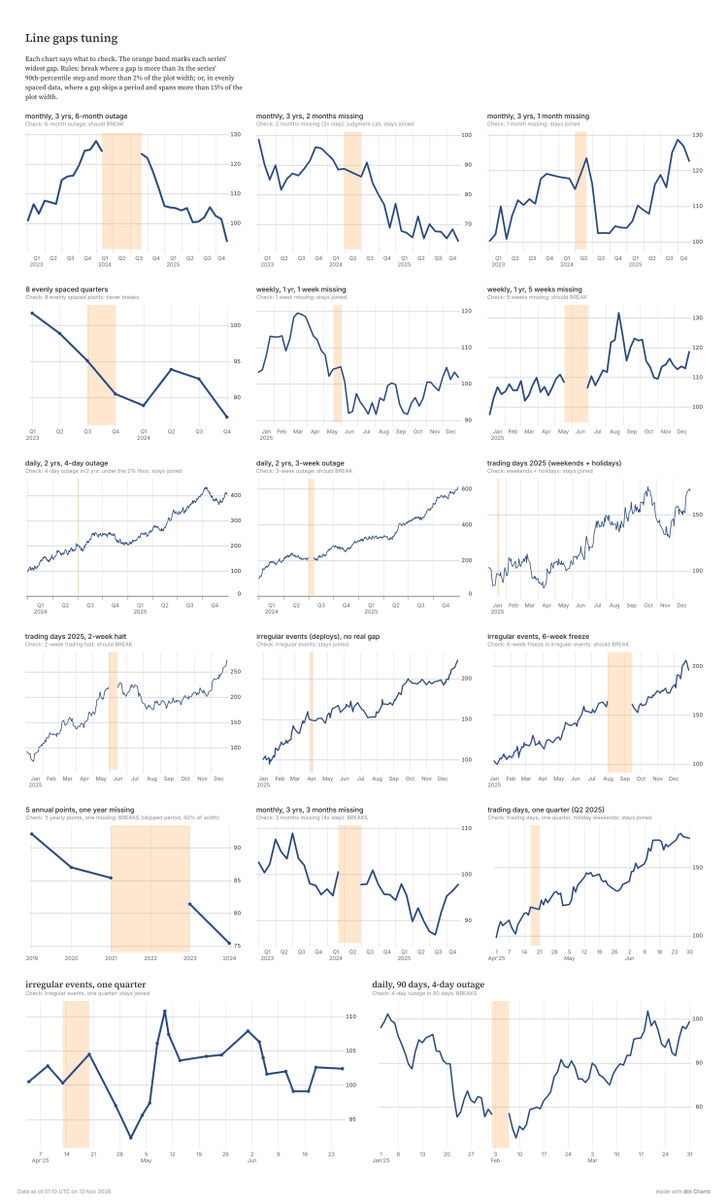
We’ve open sourced dbt Charts, a declarative language for dashboards, so that even the dashboards you build by chatting with an agent can be governed. Learn more here, https://t.co/C98l6CakyA
We love to see the community talk about dbt Charts - check out this dbt Charts tutorial about delivering dbt dashboards in pipelines with Orchestra! - https://t.co/uG47XMwLhc
dbt Charts aims to be the Markdown of dashboards. Now it works the other way too: a charts fence puts a chart in any Markdown file, on any site. https://t.co/1T2nJpqT9t
Today is the DAY - MUSEUM OF FINE CHARTS and talks on dbt Charts, Jev Models and more. 5 pm tonight at the Fivetran office in Oakland. Join us - https://t.co/CzeCUAJJSP
Who is in Oakland on November 10th? Join the dbt Charts team at the Bay Area dbt Meetup. Hear from @__dave@infowetrust to learn more and even experience a pop-up museum of fine charts! RSVP through the meetup page here, https://t.co/kINKQqFlEk
No login required. Turn on public access in dbt Charts and share dashboards with just a link. Check out how Josh Andrews with Dorian Insights used dbt Charts to show how AI is affecting bug fixing in @PostgreSQL https://t.co/r8Hns04TS3
Join us next week to learn all about dbt Charts and see it in action. Hear from @infowetrust and @__dave about giving AI the context to understand your data and produce answers your business can trust. Register here, https://t.co/OcNfhqIzPS
This past week we announced dbt Charts Custom Charts and new data warehouse connectors such as @databricks@MicrosoftFabric and Microsoft SQL Server https://t.co/9PnupjWbdL