A community health advocate working to promote health, prevention, and improved access to well-being._A data analyst in view_Growing seriously. Living playfully
📖 5 Essential DAX Functions Every Power BI User Must Know
🔗 https://t.co/jUFfPLCXX3
Get all our tutorials: https://t.co/WvUop0cgpj
#PowerBI#datafam#dataviz
I focused on building a report that highlights key trends, trying not to overcrowd the dashboard with too many visuals. Still learning, projects like this are helping me become more confident working independently with data.
#DataAnalyticsLockedIn
I’m still very much a beginner, sincerely there were moments I felt unsure about what I was doing, what kept me was just determination. I’ll be sharing some of the visuals from the analysis next.
#DataAnalyticsLockedIn
Day 53/120
Today I picked a phone sales dataset for my first independent data analysis project.
Starting without following a tutorial felt different. I had to think through the questions, decide what to analyze, and figure out how to structure the data in a way that made sense.
Another master class
Weldone
Do well to set a reminder for the space on Saturday
Where we would have experts come review and give is feedback on our dashboards.
https://t.co/P1y3p82Xkt
It wasn’t as straightforward as I expected. I had to rethink a few visuals and simplify things because some parts felt too crowded or unclear.
#DataAnalyticsLockedIn
Still working on my dashboard project.
Today I focused on improving the visuals and adding insights so the dashboard can explain itself at a glance. I realize it’s not just putting charts together, but making sure someone can look at it and immediately understand what’s going on
Day 46
I continued working on optimizing DAX measures.
Paying more attention to how I structure things so they’re easier to understand. I also spent time figuring out when to use measures versus calculated columns, which is still a bit confusing but getting clearer with practice.
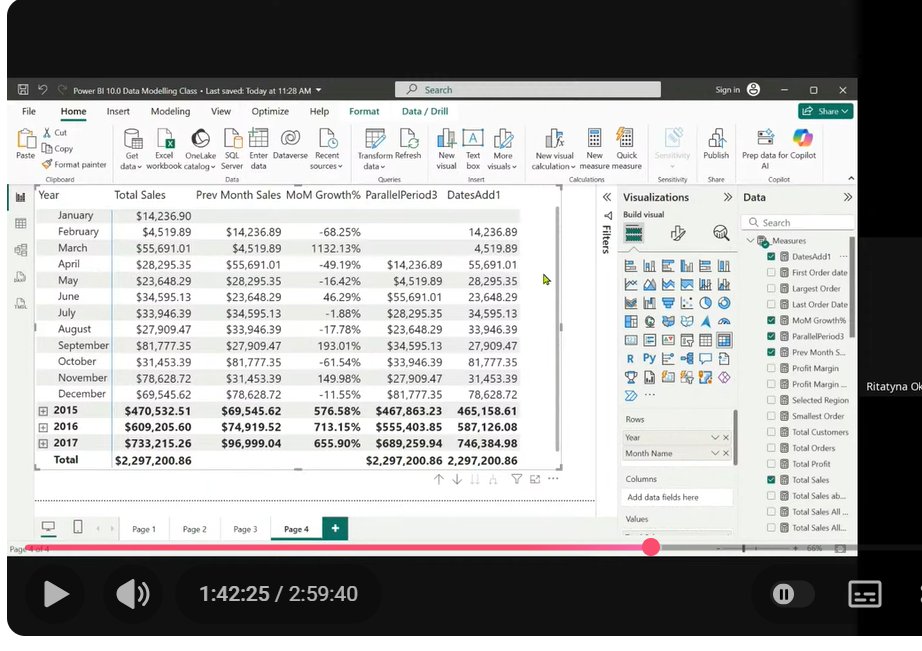
I worked on time-based calculations using DAX.
I explored time intelligence functions and how they let you work with data across different periods—days, months, quarters, and years.Applying it made me realize how important it is to have your date table set up properly.@Rita_tyna
But after a few tries, I started to notice how small changes in context can completely affect the result
Still wrapping my head around it, though it’s starting to click.
#DataAnalyticsLockedIn@Rita_tyna
Day 44
I practiced using DAX while building components in a data model.
I spent time exploring how the FILTER function works and how CALCULATE can change the context of a measure. At first, it felt like I was writing formulas without fully seeing what was happening underneath.
It's interesting to see how you can create new insights just by writing small expressions
Still early, but I can tell this is something that will take practice to really get comfortable with.
#DataAnalyticsLockedIn
Day 43
Today I moved into DAX (Data Analysis Expressions).
It’s basically the engine behind calculations, and I started seeing how it’s used to create calculated columns. I like how the syntax gives you a way to add more meaning to your data without changing the original dataset.