SpaceX is targeting a $1.75T IPO valuation. The real numbers are now public for the first time after its May 20, 2026 S 1 filing.
But... let's pull them apart and run them against $MSFT and $AMZN on every line that matters.
Let's talk how atrociously mispriced the market is.
How $AMZN and $MSFT Are Positioned to Win the AI IPO Wave:
Some of the biggest IPOs in history are loading...
OpenAI is laying the groundwork for a public listing as early as the back half of 2026, with chatter pointing to a valuation as high as 1T.
Anthropic is in early talks with investment banks, with secondary markets already implying valuations approaching 1T and a possible debut around October 2026.
Combined, these two listings could raise more capital than every US IPO since 2022 put together.
Two public mega caps sit at the center of this. Microsoft and Amazon. Both have engineered positions that let them capture upside from either lab going public, regardless of which one prints first.
This is the breakdown.
I think risk has materially shifted. Here's a proprietary indicator I made awhile back depicting that.
Aside from that... many other data points above & more showing some notable probability of possible shift over the coming 2 month period.
And btw... as we both know given the last 2 months, and the 2 months before that, 2 months is a long time in the market.
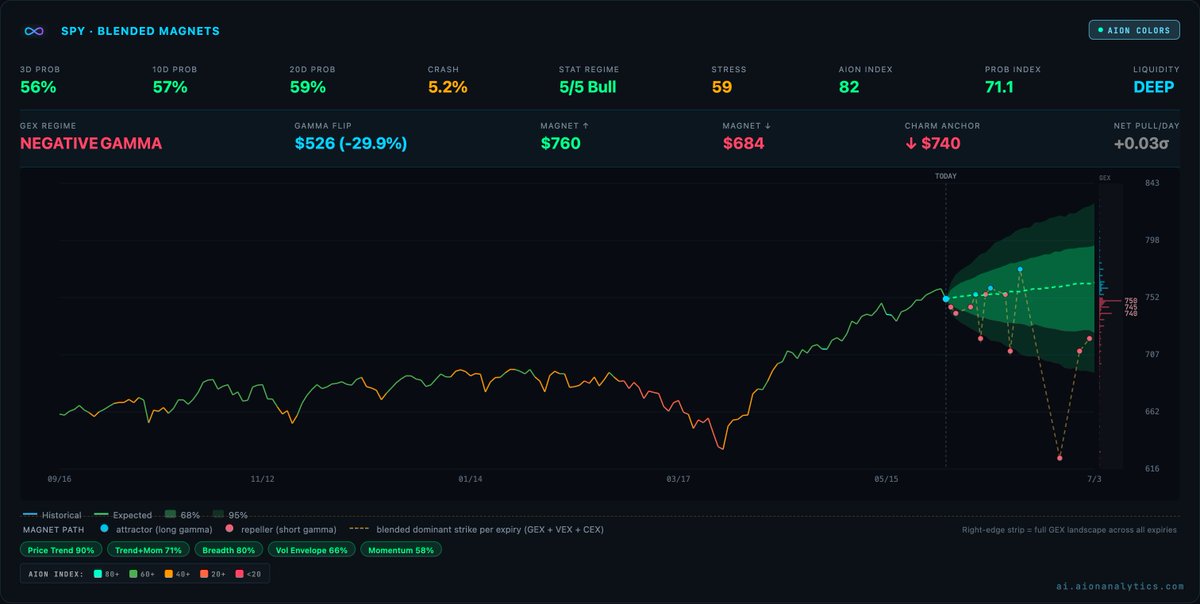
$SPY is showing me something I do not see often.
The trend models are maxed out bullish. 5/5 bull. 90% price trend. Green across every horizon.
The options market is positioned the opposite way.
Negative gamma. Charm pulling down. Downside magnet sitting below price.
A bullish trend stacked on fragile structure. That is money positioned for a big move, not a calm grind higher.
Negative gamma means it gets amplified whichever way it goes. And the pull right now is down.
Lets see if it stays that way...
Unfortunately, positioning on the $VXX adds strength to this idea too.
So is this just a blip?
Maybe. A single red day after a record high is not a top.
The tape shakes people out and grinds higher all the time.
But here is what stays with me.
Follow the liquidity and the clock points to a top in late June. And the things flashing today are the ones that tend to show up near the end, not the middle. The hedge is leading. Positioning has turned fragile. The downside winners are starting to accelerate.
Nobody rings a bell at the top. The index keeps printing green while the internals quietly change sides.
This is not a call. It is a warning light.
Maybe it is nothing. But this is what the early part of something always looks like.
Flag four, and it is early, but it is starting.
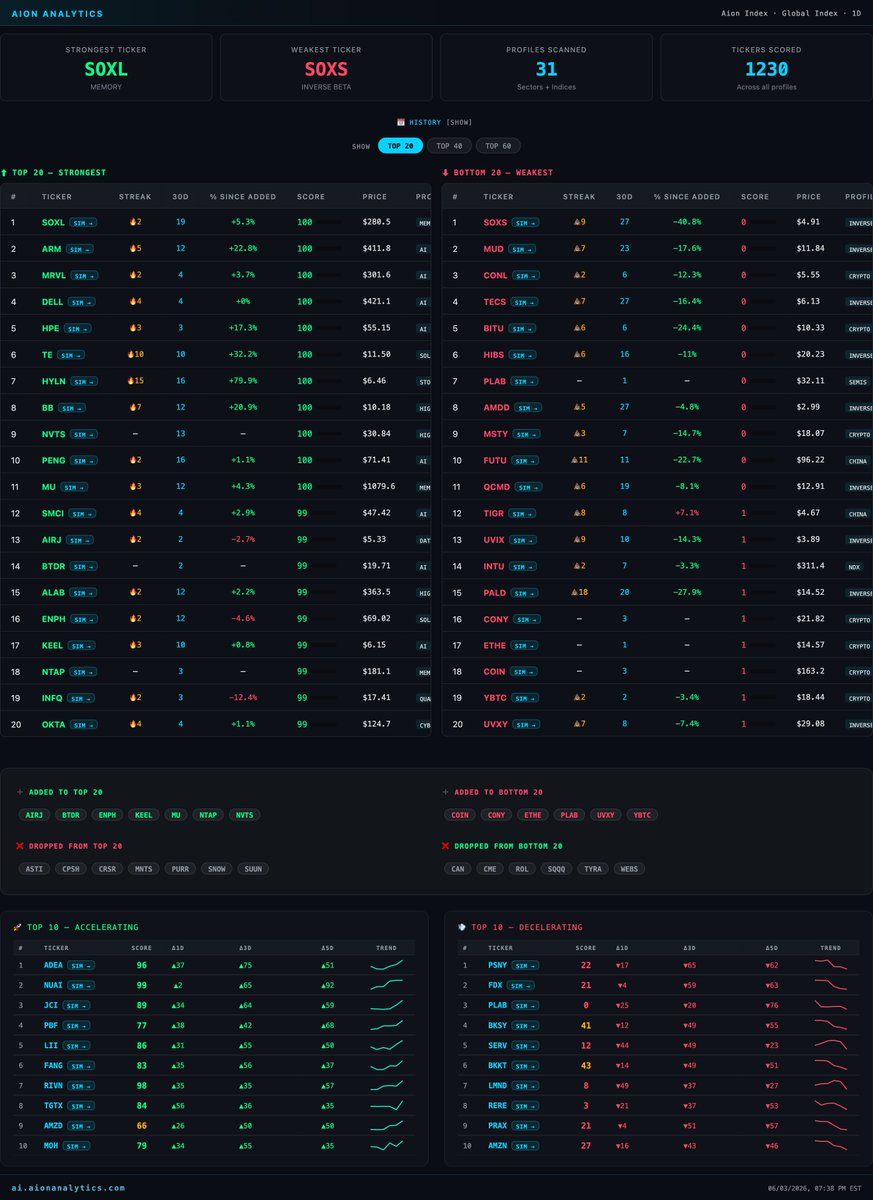
The daily tape still reads bullish. Strongest name is a leveraged semis play. The whole top 20 is AI and chips.
But the first downside winners are accelerating now.
Inverse Amazon is climbing while Amazon rolls over. The inverse Nasdaq just left the weakest list.
The shorts move before the index does. Watch this list over the next week.
Just look at those downside %s since added... they're starting to give the Top 20 Strongest a run for their money.
Flag two. The tide is going out.
Global liquidity is the last thing still flashing supportive. Weekly trend green. Up 2.5 on the week.
But read the forecast, not the label.
The model has liquidity draining from late june into late-July. The one tailwind left rolls over right as the market walks into the weakest stretch of its year.
Tops form when the final support quietly leaves. This is the final support, and it is scheduled to leave.
Flag one. The hedge is in front.
After today's selloff, Inverse Beta is the strongest sector on the 1H. Out of 1,125 scored names, the basket built to rise when stocks fall is sitting at number one. 71% of it is in the top leadership tier. Average score 79.
Step out to the 4H and it is the second fastest accelerating sector in the whole universe. Up 16.5 over three days. Up 19.5 over five.
So this is not a one hour blip. The bearish basket has been climbing for days. The selloff just put it on top.