Something to read on this Saturday: "Machine Learning Meets Markowitz". The paper proposes an end-to-end (E2E) framework that trains the ML model to directly maximize realized utility instead of pred accuracy (MSE here). Results show ~12% higher returns vs traditional two-stage approach on China A-shares.
HOWEVER:
- Only tested on China A-share market—no cross-market validation
- Uses diagonal covariance only (ignores correlations entirely)
- Gains shrink heavily with realistic transaction costs
- Performance gap nearly disappears for risk-averse investors
- Value-weighted results are much weaker and barely significant
- ML ends at NNs and OLS (?). Interestingly, linear models benefit from E2E training (~7pp gain), so the insight isn't really ML-specific
Also, this is the classic rivalry among predictive frameworks -> predict the signal, and then optimize vs directly optimize. In this market the latter seems to be working better but often the former should be prioritized; I wrote an article on this some time ago.
Link: https://t.co/LZXHV5IMPK
Euro Tether has flipped to HIGH RISK on our Stablecoin Risk Tracker.
This is the first time in over a year that any stablecoin has moved into high risk territory on the model.
Risk is no longer theoretical. If you’re holding exposure here, understand the counterparty, move your funds, understand the liquidity, and don’t ignore the signal.
This is exactly why stablecoin risk matters, especially when everyone assumes they’re "safe"
https://t.co/c70TUxZU6M
When Gold Buys This Much Oil, the Market Is Bracing for Something
This chart is really just asking how much oil can you buy with gold? And at about 0.51 grams per barrel, the answer right now is a lot. That’s extreme. Historically, you don’t see oil this cheap relative to gold unless something is off in the real economy or people are paying up for insurance. Oil is tied to actual demand with shipping, travel, production. Gold is tied to trust, uncertainty, and the long arc of policy. When gold buys this much oil, the market is leaning toward protection over growth.
Look at the past troughs and the pattern is pretty consistent. These lows show up around demand shocks or financial stress like in the late 90s in Asia, 2008, 2020. Oil gets hit first because demand weakens, while gold holds up because uncertainty doesn’t fade as fast as inflation. That fits the current backdrop if a global slowdown is coming. The key thing, though, is that these extremes rarely last forever. Either recession deepens and oil stays suppressed longer than people expect, or policy easing, supply risk, or recovery flips the script and oil snaps back hard. Historically, when this ratio turns, it tends to do so fast and that’s what makes this level less a resting place and more a sign that something is about to change.
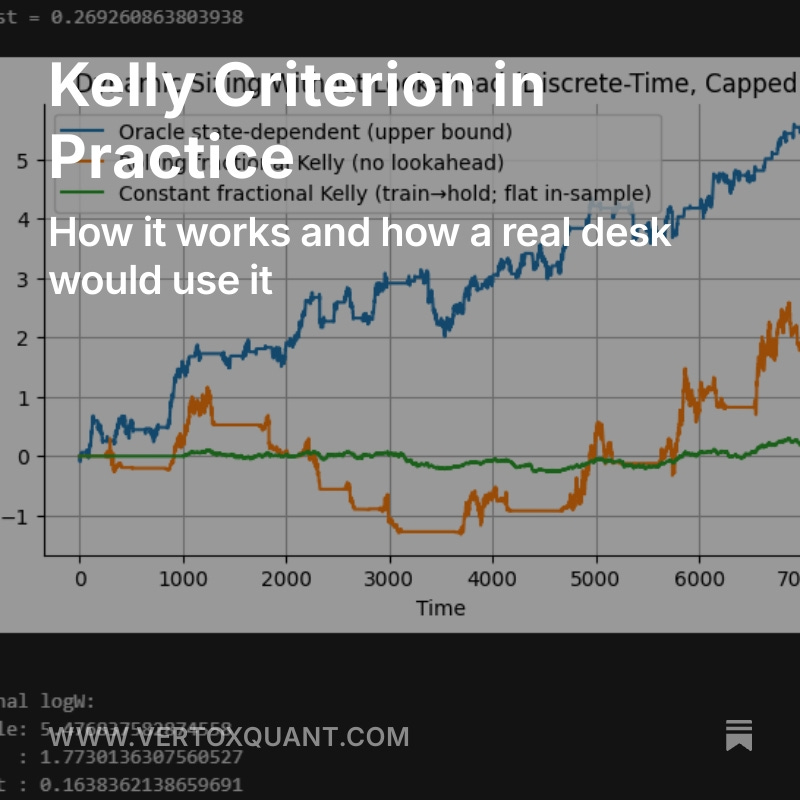
New article!
We do better than Half-Kelly and other heuristics by explaining the theory behind the Kelly Criterion.
We talk about how it's actually used in practice, using methods like Bayesian Inference to update odds, or shrinkage for stability.
Link in Profile Bio.
Stochastic volatility models such as Hull-White and Heston assume that instantaneous volatility is mean-reverting and Markov (distribution of future values depends on the current value). More recently, the Rough Fractional Stochastic Volatility (RFSV) model of Gatheral https://t.co/hukKYB0NW3 models instantaneous log volatility as a Fractional Brownian Motion with long-range dependence, with Hurst parameter H typically about 0.1, vs 0.5 for regular Brownian motion. Gatheral says the RFSV model is better able to the term structure of SPX implied volatility skew and can forecast realized vol better than the HAR model. He has videos such as https://t.co/NeV0XVzdIX and co-authored the 2023 book Rough Volatility https://t.co/JZceqqxsay . He is on GitHub at https://t.co/kWpKd2rxb7.
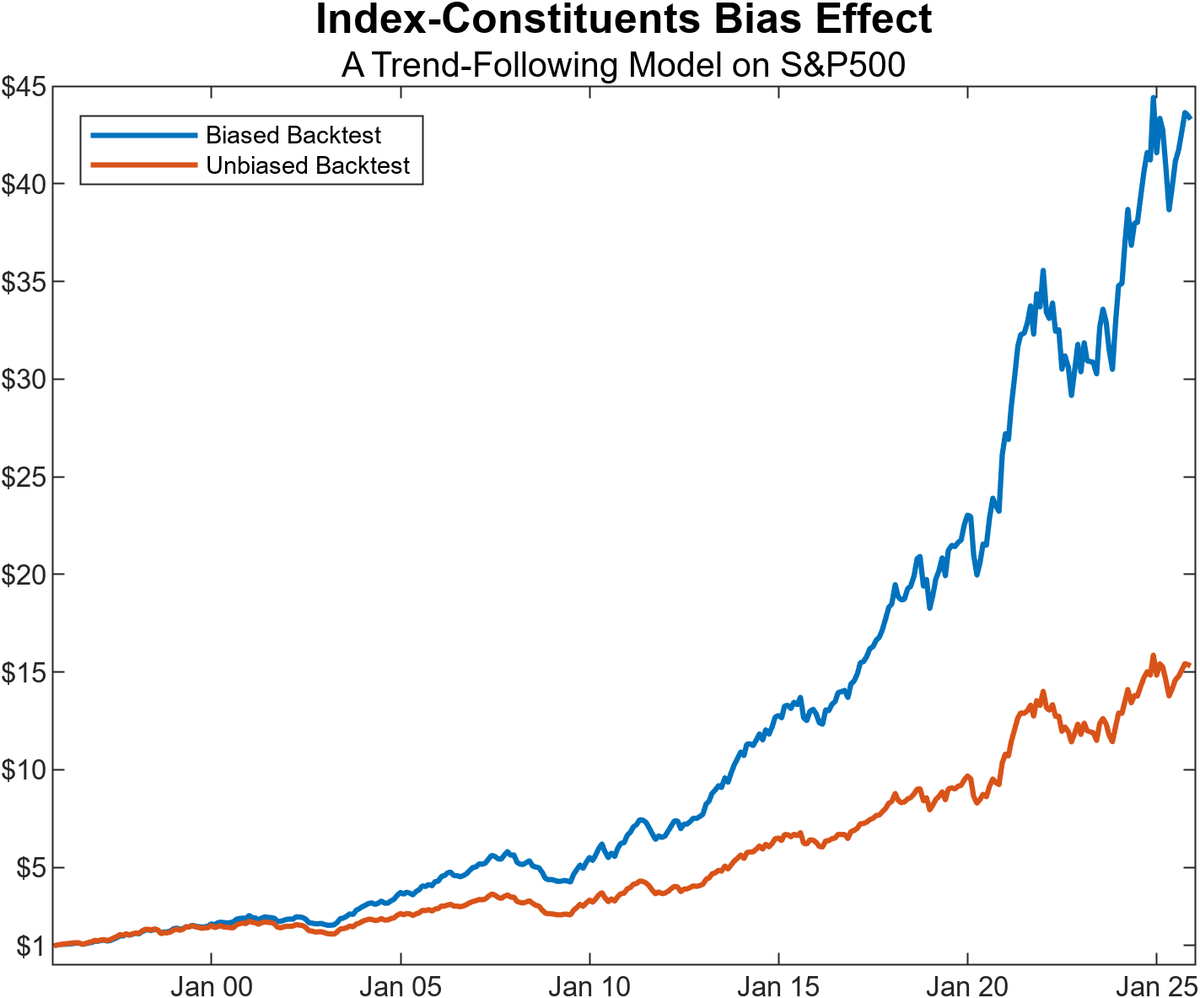
Many backtests look “too good” for a simple reason: index constituent survivorship bias.
If you do equity quant research, here’s an essential tool for unbiased backtesting: how to build a point-in-time index constituent list (tickers + entry/exit dates) in Python.
It happens when you test a strategy on an index universe (e.g., the S&P 500) but you only use today’s constituents, instead of the constituents that actually existed on each historical date.
A practical example (see chart)
Imagine backtesting a trend-following strategy on the S&P 500 using only the current members. Results can be materially inflated, because today’s constituents are, by construction, the survivors. It’s entirely plausible that many of the companies that made it into (and stayed in) the index are also those that compounded the most over the last decades while the names that underperformed, disappeared, or were removed never show up in your test.
If your universe is not point-in-time accurate, your backtest is not telling you what you think it is.
In our new article, we share a clean procedure to download index membership with entry and exit dates using Python + @NorgateData, a database we believe every serious retail quant should consider.
You can read the full article with Python code from our website. More details in comments