US Stock RWA trading just got cheaper on Delta Exchange🚨
Fees reduced to 2 bps maker + 2 bps taker across US Stock RWA tokens like AAPL, TSLA, NVDA, AMZN, META, COIN, SNDK, MSTR and more.
Plus, Scalper Offer is applicable too.
Trade global stock volatility on Delta Exchange. 🚀
ethereum:native is building structure between key levels, holding a recent support-resistance flip while finding short-term footing above dynamic support.
Key Technical Observations:
•Breakout Level as Support:
The previous resistance zone of 1,840 – $1,855 successfully flipped into demand, with the recent intermediate low right at this breakout point before price reversed.
• 34 EMA Support: Following the bounce, ethereum:native is taking support at EMA maintaining short-term stability.
• Higher Highs & Resistance:
Structurally, while price printed a higher high, the resistance zone is at 1,950 – 1,970, keeping price capped for now.
Two Scenarios to Watch:
•Upside Continuation: A sustained breakout and acceptance above $1,970 would confirm structural expansion.
•Range Consolidation: Failure to close above overhead resistance could send price back down to test EMA or recheck the $1,840 – $1,855 support base.
How do you see this chart- will ethereum:native push through $1,970 resistance, or remain bound within this structural range?
Drop your technical bias below!
ethereum:native #CryptoTrading #TechnicalAnalysis #Ethereum #Crypto
Implied volatility tells you how much movement is priced.
Options skew tells you which direction traders are terrified of.
Skew shows whether volatility is being priced equally across calls and puts.
When downside puts trade at a higher IV than comparable upside calls, traders are paying a heavy premium for downside protection.
Does this mean an immediate crash? Not necessarily, but that put premium reflects:
• Institutional portfolio hedging
• Asymmetric fear of a sharp liquidation wick
• Market makers demanding compensation for downside convexity
• A lack of natural sellers willing to underwrite tail risk
How to read Skew in real-time:
•Price Falls + Put Skew Rises: Panic hedging. Demand for downside protection is accelerating as the market drops.
•Price Rises + Put Skew Stays Elevated: Cautious rally. Traders are taking spot/long exposure while actively buying downside insurance.
•Price Flat + Call Skew Rises: Bullish speculation. Traders are paying up for upside optionality before price even moves.
Skew doesn’t tell you where bitcoin:native must go. It tells you which outcome has become expensive to insure against.
Measure the cost of insurance, not just IV in isolation.
Bookmark this framework for analyzing options sentiment on Delta Exchange.
#CryptoOptions #OptionsTrading #DeltaExchange
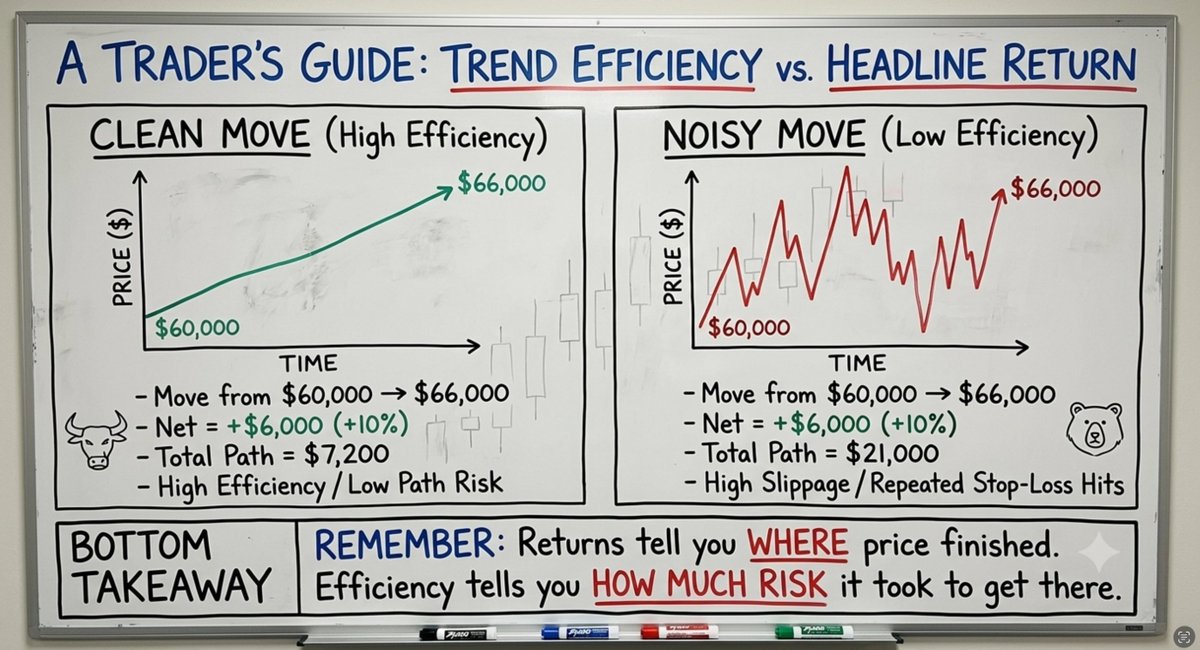
Headline return tells you where the price finished.
Trend efficiency tells you how much risk it demands.
Two bitcoin:native moves can both print an identical +10% gain (from $60,000 to $66,000):
• Move 1: A clean, steady directional trend.
• Move 2: A choppy sequence of sharp rallies, fake breakouts, and $2,000 deep reversals.
The closing return is the same but trading opportunity is not.
The Math of Trend Efficiency:
BTC moves from $60,000 to $66,000
Net move = $6,000.
• High Efficiency:
Total path distance travelled = ~$7,200
• Low Efficiency (Noise):
Total path distance travelled = ~$21,000 across endless advances and drops.
The second move delivers the same headline return with 3x the path risk.
Why Headline Returns Lie:
Chop hides the friction that drains derivative accounts:
•Frequent stop-loss triggers
•Slippage from repeated re-entries
•Weak breakout follow-through
•Increased liquidation risk on leveraged positions
•Heavy emotional and capital drawdown
•A market can be directionally right, but structurally brutal to trade.
Measure the quality of the move!!!
Bookmark this reminder for the next choppy market regime.
#CryptoTrading #RiskManagement #DeltaExchange
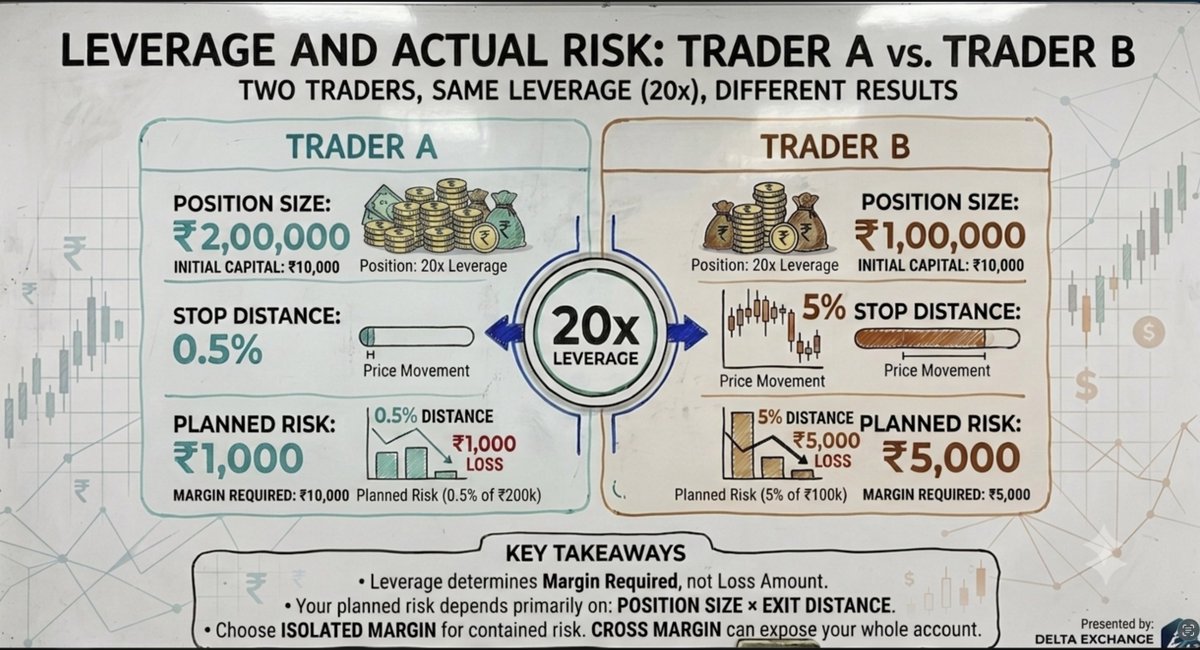
The biggest misconception in trading: Leverage determines your risk.
Two traders each start with ₹10,000 in capital.
Both use 20x leverage. One plans to risk ₹500. The other plans to risk ₹5,000.
How?
Trader A
• Initial Capital: ₹10,000
• Position Size: ₹20,000
• Stop Distance: 2.5%
• Planned Risk: ₹500 (5% of account)
Trader B
• Initial Capital: ₹10,000
• Position Size: ₹1,00,000
• Stop Distance: 5%
• Planned Risk: ₹5,000 (50% of account)
Both use 20x. Both have the exact same starting capital. But their exposure is completely different.
Leverage simply tells you how much margin you need to open the position. It does NOT dictate how many rupees you will lose.
Your planned risk = Position Size × Distance to Exit.
20x leverage just means you are putting up 5% collateral.
It is capital efficiency, not a death sentence.
But margin mode matters
•Isolated Margin: Restricts collateral to just that trade.
•Cross Margin: Uses your whole account to keep the trade alive.
A farther liquidation price feels safe, but quietly exposes your entire stack.
Bottom Line:
Leverage = Capital Efficiency
Position Size = Exposure
Stop Loss = Planned Risk
Slippage = Operational cost
Plan your trades, Protect your capital.
Which margin mode do you use most often-Isolated or Cross? Let us know below.
#CryptoTrading #RiskManagement #FuturesTrading #CryptoDerivatives bitcoin:native
NEW LISTING ALERT!
Looking to diversify your trading strategies?
Gold ($XAUT) Options are officially LIVE on Delta Exchange!
Trade Gold ethereum:0x68749665ff8d2d112fa859aa293f07a622782f38 options to combine the stability of gold with the flexibility of crypto options trading.
Check out the options chain and take your trading to the next level
#DeltaExchange #GoldOptions #XAUT
Funding was deducted from your perpetual position.
But Delta did not keep it. So, who received the money?
Funding is exchanged between traders holding long and short perpetual positions.
•When funding is positive: Longs pay shorts.
•When funding is negative: Shorts pay longs.
Why does this happen?
Unlike a traditional future, a perpetual contract has no expiry. Instead, funding enables the price to converge with the spot.
•Generally, If the perpetual trades above spot, positive funding makes leveraged longs more expensive to hold.
•Generally, If it trades below spot, negative funding makes short positions more expensive to hold.
But funding is not a direct trading signal.
High positive funding does not guarantee that Bitcoin will fall. It only tells you that longs are paying to maintain exposure.
A question to ask: Are those traders being rewarded?
If funding keeps rising but price stops advancing, long positioning may be getting crowded.
Funding tells you which side is paying. Price tells you whether that side is winning.
"What's the highest funding rate you’ve ever paid (or received)?
Let us know below!
#CryptoTrading #Bitcoin #CryptoTwitter $btc
The ECB rate decision drops at 5:45 today, with Lagarde speaking at 6:15 p.m
This creates two separate questions for a crypto options trader today:
1) Where can bitcoin:native move?
•We are currently near the 65,800 to 66,000 max-pain level.
•Nearest Support: 64,500 - $65,000 (recent consolidation floor)
•Nearest Supply: 66,800 - 67,500 (next heavy resistance)
2) How much movement is already priced in?
Short-dated ATM Implied Volatility sitting at roughly 33.7%
From that we can calculate that the market is pricing a daily implied move of 1.76%.
So, the ATM straddle is currently pricing in a move of roughly $1,160 in either direction before the event settles.
The four useful outcomes:
•Large move (>$1,160) + IV holds: Uncertainty remains; premium can stay supported.
•Large move (>$1,160) + IV falls: Direction pays, but some event premium disappears.
•Small move (<$1,160) + IV falls: The classic IV-crush risk for option buyers.
•Small move (<$1,160) + IV holds: The market may still be pricing another catalyst.
The event headline does not determine option P&L by itself.
The realised move must be compared against the options market priced move.
#CryptoOptions #Bitcoin #OptionsTrading
🚨 Crypto Tax in India, FULLY explained (2026 edition)
If you trade on Delta Exchange (spot or derivatives), this one's for you 👇
✅ How tax is calculated on spot vs derivatives
✅ What "Turnover" actually means & how to track it live
✅ Step-by-step ITR filing using KoinX @getkoinx
🎁 Get 80% OFF on ITR Filing - Code: DELTA80
Watch full video on YouTube- https://t.co/IbOh5jTB45
solana:5GgRAEmv8ZxF2PR5hY72Qs5x1bnQ6UK2RbTPoqJ3wSwW built strong momentum off the $3.9k - 4k support area, delivering a +100 point move into the short- term resistance at 4100.
Key Technical Observations:
•Demand Absorption: The $3,950 - $4,000 key support floor, validating buyers' defense of the zone.
•Trend Confluence: Price is respecting the upward-sloping channel boundaries, now testing short term supply overhead near $4,100 - $4,120.
•Compression at Resistance: Volatility is tightening near the upper channel line, building up the next potential move.
As price compresses against the upper boundary of this ascending channel, two key scenarios emerge:
•Breakout Continuation: Acceptance above $4,120 shifts market structure to unlock further upside expansion.
•Channel Rejection: A failure to hold above $4,100 triggers a pullback to retest trendline support.
Are you waiting for structural breakout confirmation before taking fresh long positions? Or eyeing a potential liquidity sweep and breakdown back toward the channel floor?
Drop your technical bias below!
solana:5GgRAEmv8ZxF2PR5hY72Qs5x1bnQ6UK2RbTPoqJ3wSwW #CryptoTrading #TechnicalAnalysis #Gold
Max pain is only one part of the options picture.
What do you check next before forming an expiry-day view?
Vote- and we’ll decode the winning metric next.
#Bitcoin#CryptoOptions bitcoin:native ethereum:native
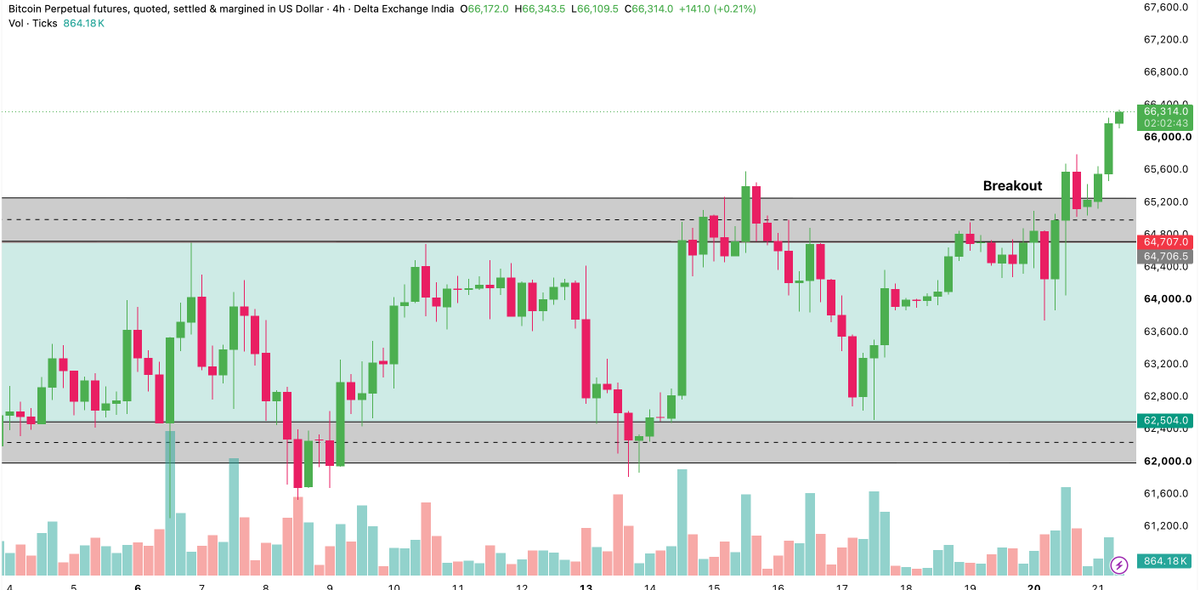
$BTC broke out of a well-defined macro range following a clean structural shift.
Here is how the market structure looks across the 4H and 15M charts:
• The Horizontal Range: Volatility compressed as price spent days forming swing bottoms and peaks within the boundaries.
• Demand Floor: $62,000 – $62,500
• Supply Ceiling: $64,700 – $65,100
A range breakout is only as strong as the conviction behind it. Look closely at the expansion point:
• The Candle: A decisive, large-bodied 4H expansion candle closing cleanly above the $65,300 resistance level.
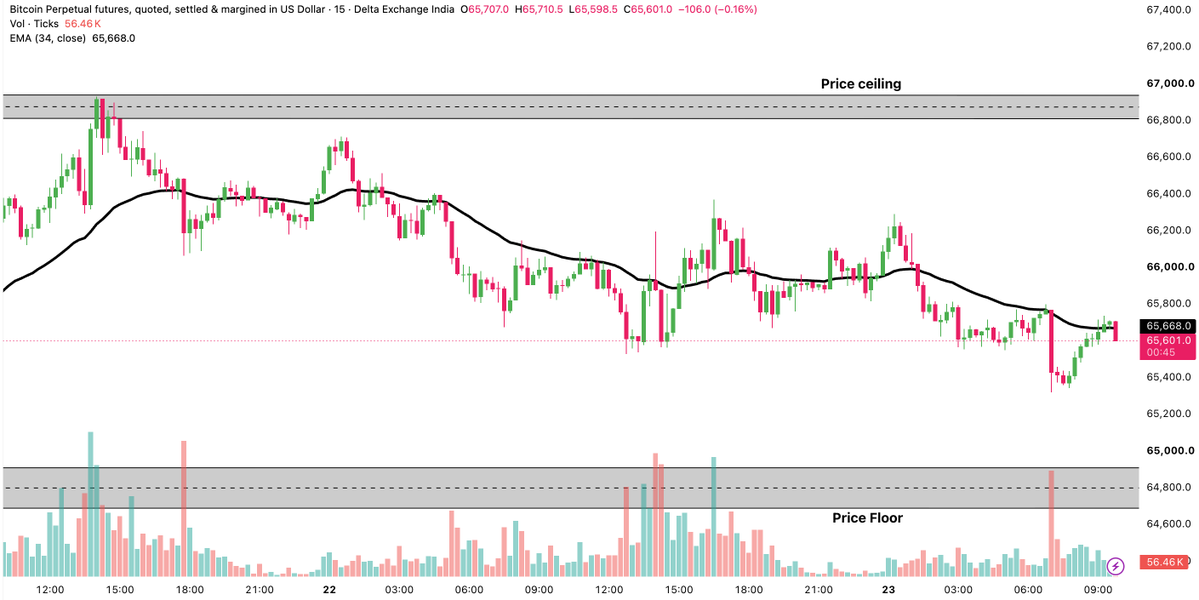
•On the 15M chart, price consolidated above the resistance level before starting a secondary leg up toward $66,300.
Structural Shift: When a range breakout expands with high-volume expansion and lower-timeframe consolidation, it results in a structural shift.
How do you trade horizontal range breakouts-do you buy the immediate high-volume close, or wait to trade a retest of the $65,100 zone?
Let us know in the comments below!
#Bitcoin #BTC #CryptoTrading #DeltaExchange #TechnicalAnalysis
What is the Options market pricing by expiry?
Let’s take an example:
bitcoin:native is trading at $64,500i
The ATM Call costs $1,600 and the ATM Put costs $1,400
ATM Straddle Premium = Call Premium + Put Premium
= $1,600 + $1,400
= $3,000
This gives traders a quick estimate of the implied move:
• Upper range: $64,000 + $3,000 = $67,000
• Lower range: $64,000 − $3,000 = $61,000
These are the approximate expiry breakevens for the Straddle buyer.
But this does not mean BTC will definitely remain between $61,000 and $67,000.
• It tells us how much movement is already priced into the premiums.
•If BTC expires inside this range, the move may not be enough for the Straddle buyer to recover the total premium.
•If it expires outside this range, the realised move has exceeded what the Straddle initially priced.
So, the question is will BTC move more than the Options market has already priced?
How do you look at the premiums?
Would you buy or sell volatility at this price?
#CryptoOptions #Bitcoin #tradingforbeginners
Key market catalysts to watch this week: employment data, major tech earnings, manufacturing PMI and housing data.
Which event do you expect to drive markets the most?
Rule #1 of successful trading: Protect your capital.
Before you make your first move, listen to this crucial piece of advice from R.K. Gupta.
💡 The Takeaway: Start small, manage your risk, and protect your portfolio.
Because in options, Consistency > Size. 🧠
📊 Watch the full snippet below to see exactly how he breaks it down!
#CryptoOptions #TradingTips $btc $eth #DeltaExchange
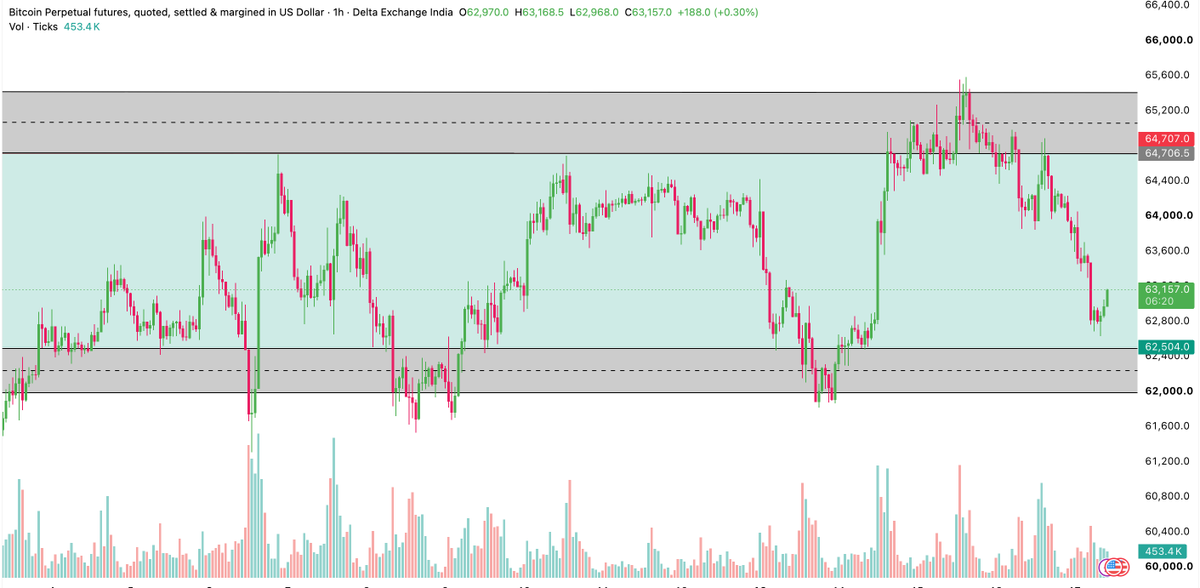
A local bottom zone is holding in bitcoin:native , but does a retest of the floor automatically guarantee a bullish continuation?
Reversals close to demand zones give high-reward executions, but executing without structural validation is a trap.
Let's break down exactly how the market equilibrium is set up on the 1H chart:
•The Range
Volatility is compressing as price action remains locked within highly defined horizontal boundaries.
•Floor Zone ($62,000 - $62,504): A demand pocket where buyers have consistently stepped in to absorb sell pressure.
•Supply Ceiling ($64,706 - $65,500): The overhead resistance block where sellers have successfully capped recent upside expansion.
The Trigger
To validate a bullish move out of the floor, we must see a confirmed candlestick reversal pattern form directly inside the demand zone.
A high-volume expansion candle structure acts as the green light.
Structural Invalidation
The range holds until it doesn't. A decisive close below the zone completely shifts the market equilibrium and invalidates the bullish trend.
If conviction shifts to the downside with a high-volume breakdown candle, the structure is broken and a deeper distribution phase begins.
How are you playing this floor zone- do you set limit orders to catch the immediate liquidity sweep, or wait for a confirmed hourly reversal candle to validate the bounce?
Let us know in the comments below.
#Bitcoin #CryptoTrading #TechnicalAnalysis #DeltaExchange
Open interest is rising but does that automatically mean the market is bullish?
•OI tells you that positions are being added.
•Price helps explain which side may be pressing.
Let’s understand how to interpret Open interest
• Price ↑ + OI ↑ suggests fresh long participation
• Price ↓ + OI ↑ suggests fresh short participation
• Price ↑ + OI ↓ may indicate short covering
• Price ↓ + OI ↓ may indicate long unwinding
OI tells you about participation.
Price gives it direction.
Which combination do you find the hardest to read?
#Bitcoin #CryptoTrading ethereum:native bitcoin:native
ethereum:native broke out of a rectangular channel after a clean structural shift.
Here is how the market structure looks on the 1H chart:
• The Parallel Range: Volatility compressed as price spent days forming bottoms and peaks within the boundaries.
•Floor at $1,700 - $1,720
•Supply ceiling at $1,800 - $1,830
A range breakout is only as strong as the conviction behind it.
Look closely at the breakout point:
• The Candle: A decisive, large-bodied expansion candle closing above the 1830 resistance level.
• The Volume: Crucially, this move was backed by a significant surge in trading volume . This confirms strong buyer participation.
Structural Shift: When a consolidation phase breakout concludes with a high-volume candle, the market equilibrium has shifted.
Understanding these distribution and accumulation zones is key to reading pure price action.
How do you trade horizontal range breakouts-do you buy the immediate high-volume close, or wait to trade a structural retest?
Let us know in the comments below.
#Ethereum #CryptoTrading #DeltaExchange #TechnicalAnalysis