🪔 Bitcoin Trading Fees Just Got Lower on Delta Exchange India!
The Diwali Scalper Offer is now live for Bitcoin Futures.
→ Close your Bitcoin trade within 30 minutes and pay 0% closing fee.
→ Get 100% of your cash-paid opening fee back as a Fee Voucher.
→ Earn up to $100 in Fee Vouchers per calendar month, calculated collectively across your main account and sub-accounts.
→ Fee Vouchers are valid for 90 days.
Already joined the Scalper Offer? The Diwali benefit applies automatically, no separate opt-in needed.
Scalp Bitcoin. Pay less. Keep more. 🚀
$BTC plummeted toward $62K, triggering a massive $1.64B liquidation wipeout while ETFs saw over $1B in outflows!
Dive into the full breakdown in Crypto Pulse Weekly #88. 👇
#Bitcoin#Ethereum#CryptoTrading#OptionsData#Macro#DeltaExchange https://t.co/TVuMqFYhcY
Gold futures on gold-backed XAUT touched $3,755 today, its lowest since it listed in April.
How do you read a chart after a drop like this?
Start with an old floor: a price where falls kept stopping.
On 30 Oct, gold’s fall stopped near $3,880–3,890.
On 13 Nov it closed about a dollar below that area, then fell further.
On 16 and 17 Nov, gold rose back to that area. Both days it turned lower and closed below it.
A common chart idea: a broken floor can act as a ceiling when price returns.
One usual reason: earlier buyers sell there to get out near what they paid.
That’s a common reading, not a proven cause.
The caveat: it doesn’t always hold. Gold’s summer floor near $3,950 broke on 30 Oct. Five days later, gold closed back above it.
The takeaway: when a floor breaks, keep it marked. Each time price returns, judge it by the daily close, not a short spike.
If gold returns to $3,880–3,890 a third time, what will you watch: the day’s high or the day’s close?
#Gold #XAUT #Trading
A price chart shows how far bitcoin:native fell. It hides how long it has stayed down.
Two numbers to check before you buy any dip: how far the coin is below its peak, and how long it has been there.
You can measure that in 10 seconds:
Underwater % = (today's price ÷ highest close − 1) × 100
bitcoin:native at Monday's close:
($64,856 ÷ $124,628 − 1) × 100 = −48%
That record close was on 6 Oct 2025, over 400 days ago.
Do the same sum for every day and you get an underwater chart (below).
This drop is the deepest and the longest so far.
Why it matters: most people size up a fall by depth alone. The length is often what tests people.
Takeaway: before buying a dip in any coin, do the sum. How far below its peak is it, and for how long? Then check its worst past drop and ask: could I sit through that again?
#Bitcoin #CryptoEducation #Trading
📉 BITCOIN SLIDES TO $62K AS CRYPTO MARKETS FACE HEAVY SELLING
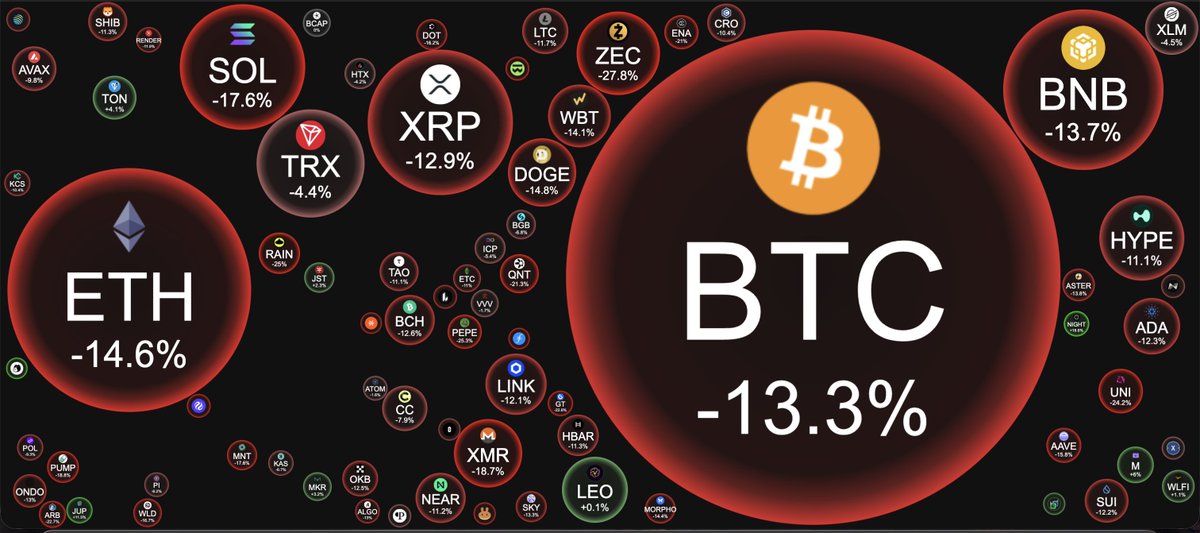
BTC plunged to $62K before rebounding above $65K, while solana:7vfCXTUXx5WJV5JADk17DUJ4ksgau7utNKj4b963voxs and major altcoins recorded double-digit weekly losses.
📉 What's driving the sell-off?
🔴 US tech and AI stock weakness
🔴 Macro uncertainty and elevated bond yields
🔴 $2.35B in Bitcoin ETF outflows over two weeks
🔴 Concerns over capital shifting toward AI investments 🔴 Nearly $2B in reported leveraged liquidations during the peak sell-off
📊 On-chain signals:
Bitcoin's $62K–$66K zone shows concentrated historical demand, but shrinking stablecoin liquidity and underwater short-term holders suggest continued market stress.
📉 Key bitcoin:native levels:
Support: $62K / $60K
Resistance: $66.7K / $70K
The rebound offers early signs of stabilization, but BTC and ETH remain below major moving averages.
Relief rally or another leg down?
The next move could depend on ETF flows, renewed spot demand and Bitcoin's ability to reclaim $70K.
🚨 Crypto Market Selloff Deepens: $1.41 Billion Liquidated in 24 Hours
$BTC plunged 6.8% to $68,700, breaking below the critical $70K level, while ethereum:native dropped 6.1% toward $1,925.
📉 Market Snapshot:
• BTC: -6.8% | ETH: -6.1%
• BNB: -6.6% | SOL: -5.7%
💥 Liquidation Wave:
According to CoinGlass, 173,177 traders were liquidated, with total liquidations reaching $1.41 billion.
📊 What's Driving the Selloff?
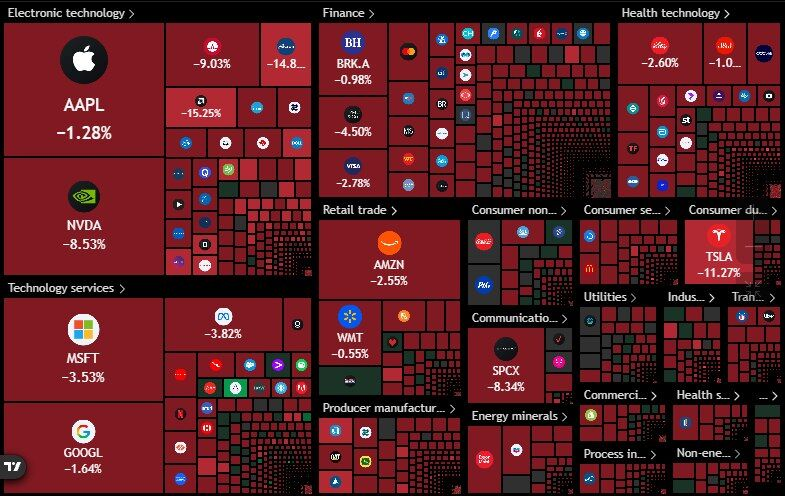
• US Equities: Weakness in Nvidia and technology stocks has weighed on risk appetite.
• ETF Outflows: Continued withdrawals from US spot Bitcoin ETFs indicate weaker institutional demand.
• Fed Expectations: Hotter-than-expected US CPI data has increased concerns about further interest-rate hikes.
• Macro Catalyst: Today's US PPI release could influence Fed policy expectations and trigger further volatility.
📉 Technical Outlook:
BTC: Trading below major daily and 4H moving averages after testing $68,500. The next downside zone lies around $64K–$67K, while $70K–$72.7K acts as resistance.
ETH: Trading near $1,925 after breaking below $2,000. Support lies around $1,850–$1,900, with resistance at $2,000–$2,043.
Market Outlook: Bearish momentum remains dominant. The next move will depend on US inflation data, ETF flows and whether BTC and ETH can reclaim their broken support levels.
Which moves more on a normal day: silver or bitcoin:native ?
Since March, the answer has been silver.
A typical silver day moved about 1.8%. A typical Bitcoin day moved about 1.3%.
Silver also had 34 days that moved 4% or more. Bitcoin had 16. (Weekdays only, since silver's main market shuts on weekends.)
So what? A 4% move can be normal for one asset and a shock for another.
Example: say you bought at the day's open and set a stop-loss (a price that triggers an automatic exit) 3% below it.
• Silver: that stop would have been hit on about 1 in 3 weekdays since March.
• Bitcoin: about 1 in 6.
Same rule, about twice as many exits.
Takeaway: Before you set a stop-loss or position size, check how much the asset usually moves in a day. Use the last few months, not what kind of asset it is.
Which asset on your watchlist moves more than its reputation suggests?
#Silver #Bitcoin #Volatility
ethereum:native did the one thing that's supposed to end a downtrend. Six days later, it hit its lowest level since 19 Aug.
Here is what the textbook rule asks for.
On a chart, a downtrend is a run of lower highs and lower lows.
From 21 Sep to 30 Oct, each ETH rise peaked below the one before. Each big dip went lower.
Ending it takes two steps:
1. Close the day above the last lower high.
2. Then make a higher low: a dip that stops above the previous low.
Step 1: The last lower high was $2,391, on 28 Oct.
On 4 Nov, ETH closed above it, at $2,423.
Step 2: The next dip had to stay above $2,173. It didn't. On 8 Nov, ETH closed below it.
Save this:
Trend change = close above the last lower high + a higher low that holds.
One without the other is only a first sign.
What would you need to see before you say ETH's trend has changed? 👇
#Ethereum #ETH #CryptoTrading
Options, Decoded: What are you paying for when you buy an option?
bitcoin:native is near $74,382.
•A call with a $75,000 strike cost about $780 per BTC.
An option's price has two parts:
Price = Intrinsic value + Time value
Intrinsic value: what it would pay if it ended now.
For a call: BTC price minus strike, or zero.
Time value: the rest.
It pays for the chance BTC moves before expiry.
BTC is below $75,000, so that call's intrinsic value is $0. All $780 is time value.
A $72,000 call is the opposite: BTC is above its strike, so it is mostly intrinsic.
Why it matters: to hold its value, an all-time-value call needs BTC to rise.
A mostly-intrinsic one mainly needs BTC not to fall.
Takeaway: before you buy, split the price in two. If BTC goes nowhere by expiry, you lose the time-value part.
Why do you think time value is biggest near BTC's price? 👇
#OptionsDecoded #Bitcoin #OptionsTrading
We acknowledge the Enforcement Directorate’s statement regarding their visit to our premises on 4th & 5th November.
Delta Exchange India is operating business as usual with no disruptions, in accordance with applicable law. Trading, deposits and withdrawals are all functioning smoothly, and user funds remain secure in Indian banks.
We cooperated fully with the officials and provided the information that they sought. We remain committed to extending our support and cooperation as may be required.
Excelium Technologies (Delta Exchange India) has been registered with the Financial Intelligence Unit - India (FIU-IND) since 2023 as a reporting entity.
We operate in complete compliance with the applicable laws and adhere to all KYC, AML, and reporting obligations.
At Delta Exchange India, our business does not involve any cross-border transfer of VDAs in any form or manner. We operate a dedicated INR-settled exchange for Indian users only.
We remain committed to upholding the highest standards of governance and compliance.
Bitcoin Slides Nearly 6% to Seven-Week Low as US Stocks Erase Post-Election Gains
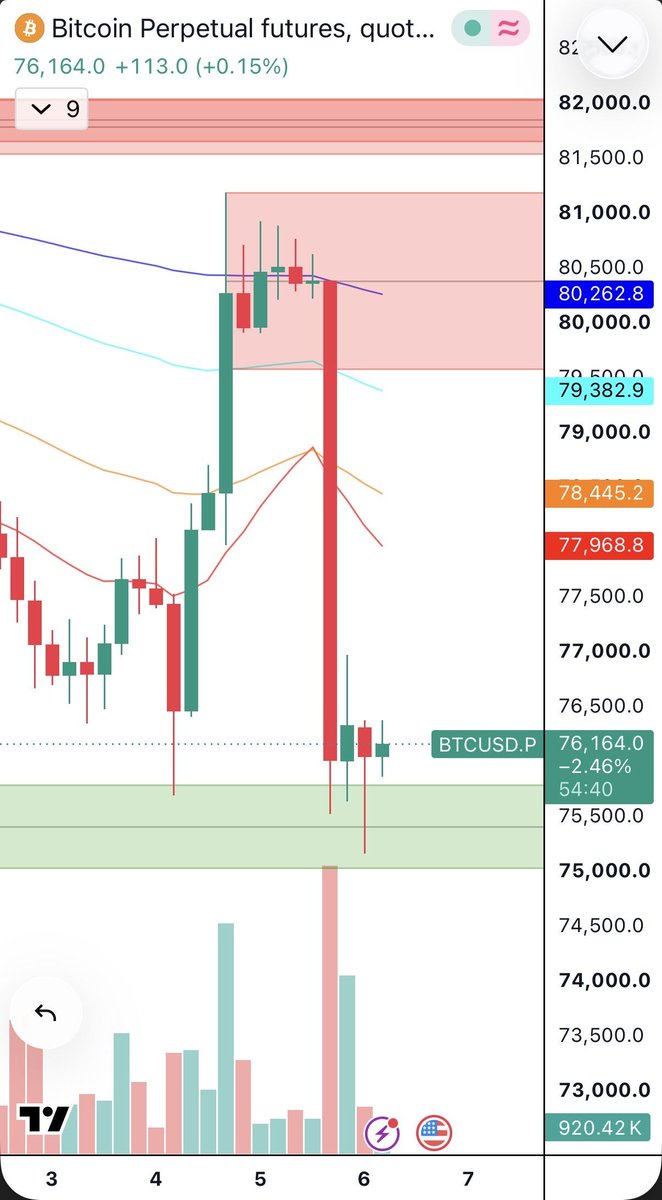
bitcoin:native recovery above $80K proved short-lived, with BTC falling nearly 6% to ~$75.2K and ethereum:native dropping almost 8% toward $2.2K.
What's driving the selloff?
🔹 US Equities: Nasdaq plunged 5.52% and S&P 500 fell 4.36%, driven by AI valuation concerns and post-election policy uncertainty.
🔹 Derivatives: 24H liquidations reached $1.18B, including $1.04B in longs. Open interest rose 8.78% to $381.49B.
🔹 Sentiment: Fear & Greed stood at 32, while Bitcoin's volatility index remained elevated near 40.
📊 Key Technical Levels
• BTC: Support at $75K–$75.7K, including the 50-week SMA near $75,733. Resistance at $77.95K–$78.45K.
• ETH: Support at $2.2K; resistance at $2.31K–$2.34K.
Both remain below their major 4H EMAs, signalling continued bearish momentum.
📅 Next Catalyst: US NFP data at 7 PM IST today could reshape Fed rate expectations and drive volatility.
Outlook: Holding key supports could trigger a technical rebound, while further US equity weakness or a breakdown below these levels may extend the correction.
BTC hit a six-week low near $77K 📉
The $6.3B Binance hack, $643M in single-day ETF outflows and a hawkish Fed made for a brutal risk-off week.
Crypto Pulse Weekly #86 covers what happened, key options levels and the macro data to watch 👇 https://t.co/LiiAlDiOtY
🎁 Diwali just got BIGGER! 🪔
Sign up on Delta Exchange and stand a chance to WIN an iPhone 18 Pro worth ₹2.5 lakh! 📱
Plus, 4,000 eligible new traders get a ₹250 Amazon voucher GUARANTEED! 🛍
Here's how:
✅️ Sign up between Nov 5–11
✅️ Complete KYC
✅️ Pay just $5 in trading fees within 7 days of signup
Your Diwali Dhamaka starts here! 🚀
👉 Offer details: https://t.co/7z87FWraq8
*T&C apply.
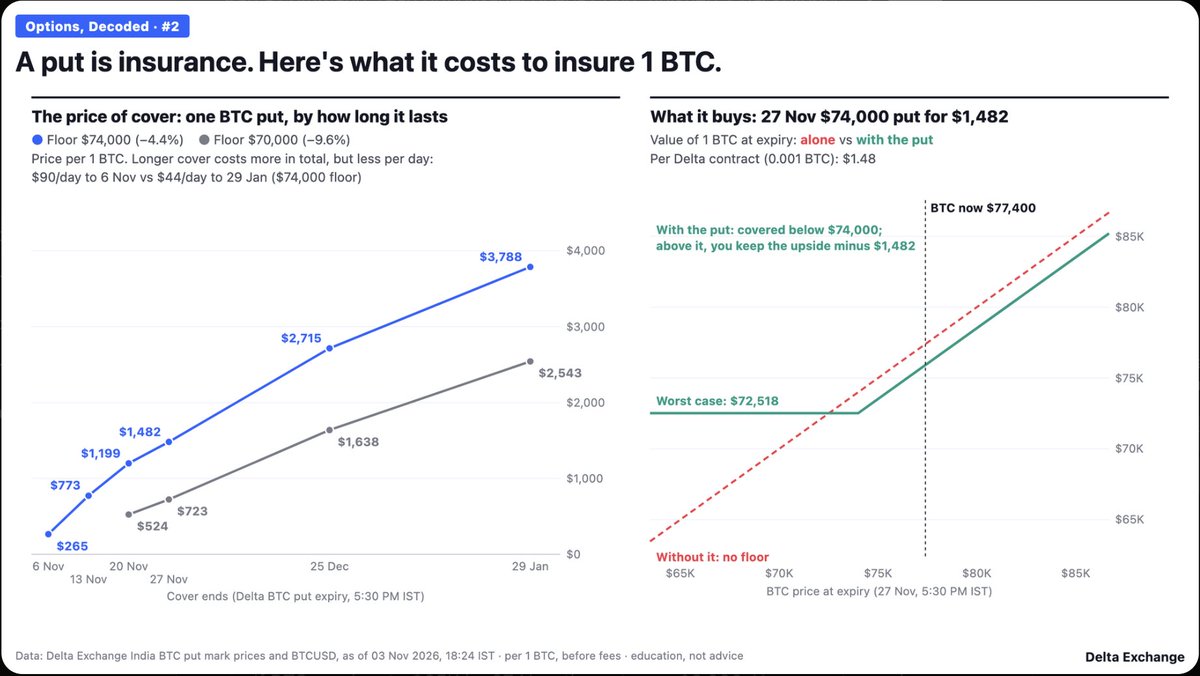
Options, Decoded #2: A put is insurance
If you hold bitcoin:native and fear a fall, a put works like an insurance policy:
A put gives you the right to sell your BTC at a fixed price, even if the market crashes
•🛡️ Premium = what you pay for the put
📉 Deductible = the gap between today’s price and the strike
Example:
•The $74,000 put for 27 Nov costs $1,482
📉 If BTC falls to $65,000, you can still sell at $74,000.
📈 If BTC rises, you lose only the $1,482, like an insurance premium you never claimed.
⚖️ Breakeven = Strike − Premium
• $74,000 − $1,482 = $72,518
Below $72,518, the put has more than paid for itself.
It works like car insurance:
• Longer cover costs more
• A bigger deductible (a lower strike price) costs less
Save this for the next time you think about protecting your BTC 🔖
#Bitcoin #Options #DeltaExchangeIndia
@TheSimplifier7 Great point.
The rejection near 4,077 was an early sign that buyers were running out of strength, well before the floor gave way.
And with that many tests, a lot of stops sat just below $4,000, which explains why the drop was so fast once it broke.
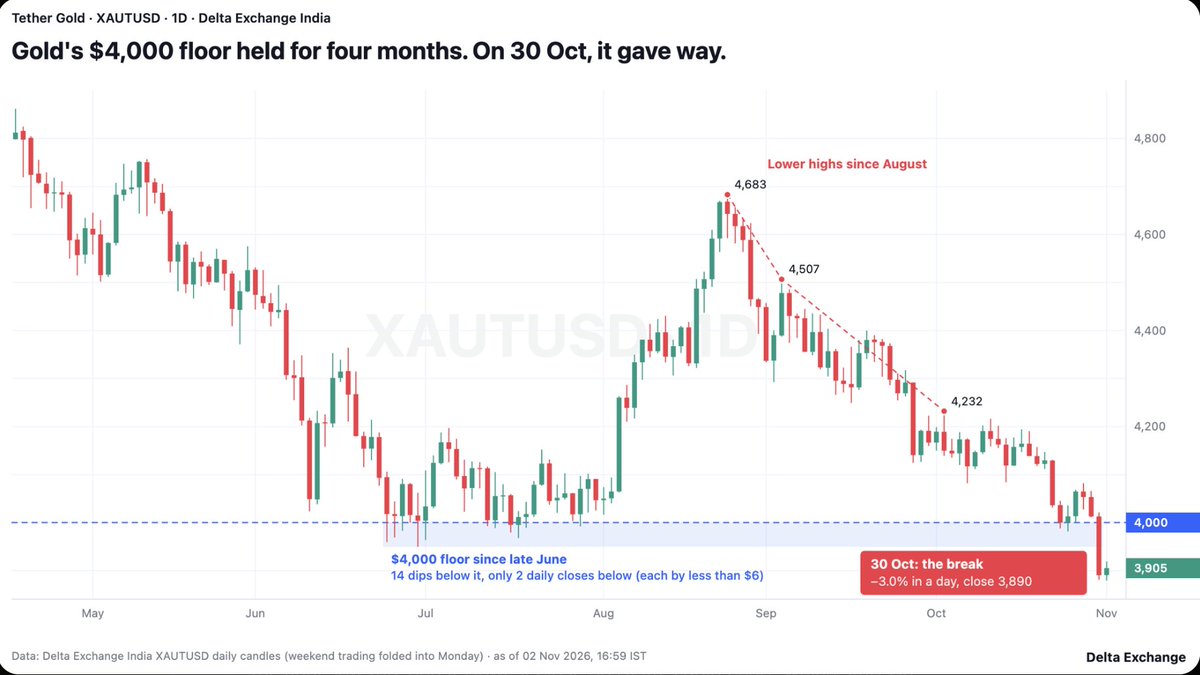
ethereum:0x68749665ff8d2d112fa859aa293f07a622782f38 $4,000 floor held for four months. On 30 Oct, it gave way.
Since late June, gold dipped below $4,000 on 14 different days.
It closed below it only twice, each time by less than $6, and bounced the next day.
On 30 Oct it fell 3% in one session and closed at $3,890, below its June low too.
The highs had been warning:
•$4,683 in August
•$4,507 in September
•$4,232 in October
Each month’s peak was lower, while buyers kept defending the same floor.
The backdrop: the Fed raised rates in September.
Gold pays no interest, so higher rates make it less attractive.
But rates don’t explain everything. Gold’s fall began in January, before yields rose, and in October real yields eased while gold kept falling.
What traders watch next is “role reversal”. A level that held as a floor for months often acts as a ceiling when price returns to it from below. It’s a pattern, not a rule.
Is $4,000 now a ceiling, or does gold reclaim it? 👇
#Gold #XAUT #DeltaExchangeIndia
$BTC is retesting the True Market Mean near $77.9K.
Even a deeper pullback toward the Short-Term Holder Cost Basis around $75.8K could still keep the broader structure intact.
Similar retests have occurred during previous uptrends- including in mid-September, shortly before BTC pushed to a new local high.
Key levels to watch:
True Market Mean: ~$77.9K
STH Cost Basis: ~$75.8K
Source: Glassnode
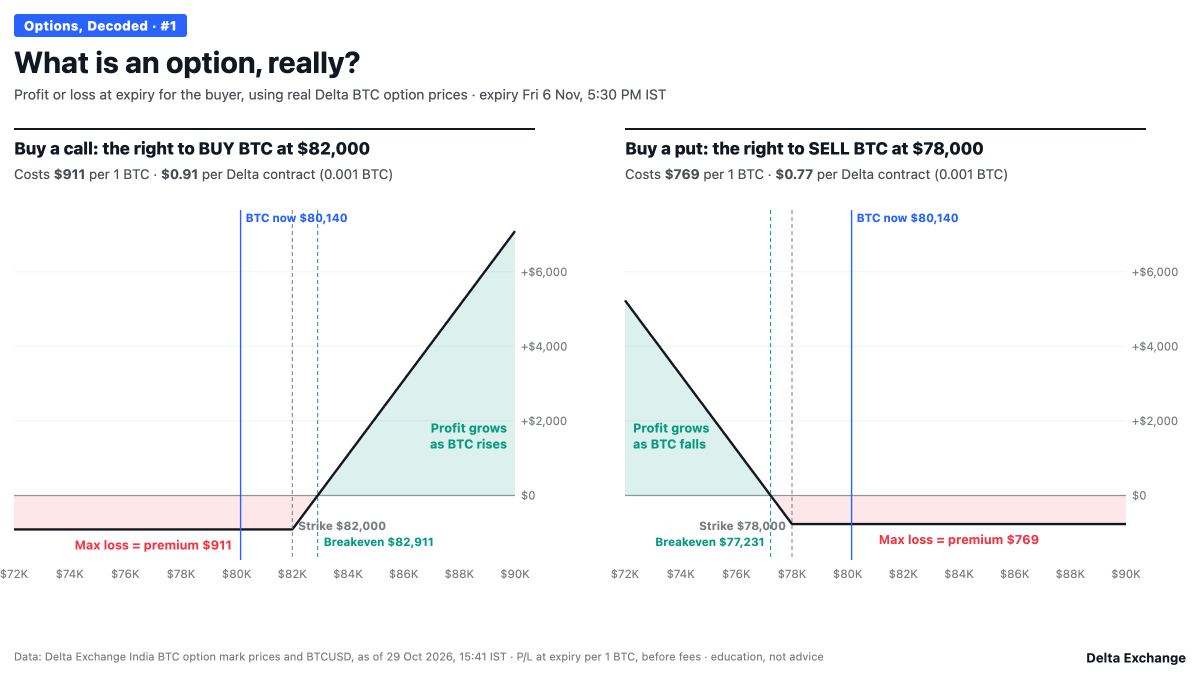
Options, Decoded #1: What is an option, really?
An option is a contract that gives you the right, but not the obligation, to buy or sell at a fixed price (the strike) on a set date (the expiry).
Two kinds:
📈 Call: the right to BUY. It pays if the price ends above the strike.
📉 Put: the right to SELL. It pays if the price ends below the strike.
A real example:
BTC at $80.1K and expiry Fri 6 Nov, 5:30 PM
• $82K call costs : $911 per bitcoin:native
BTC must finish above $82,911 for the buyer to profit.
• $78K put costs: $769 per BTC
BTC must finish below $77,231 for the buyer to profit.
If BTC ends between those levels, both buyers lose only what they paid, and the sellers keep it.
That’s the core trade-off of options: the buyer pays a small, known amount for the chance of a bigger move.
The seller collects it and carries the risk.
Next in the series: why a put is really insurance, and what it costs to insure Bitcoin for a week.
What do you want this series to explain? 👇
#OptionsDecoded #Bitcoin #OptionsTrading