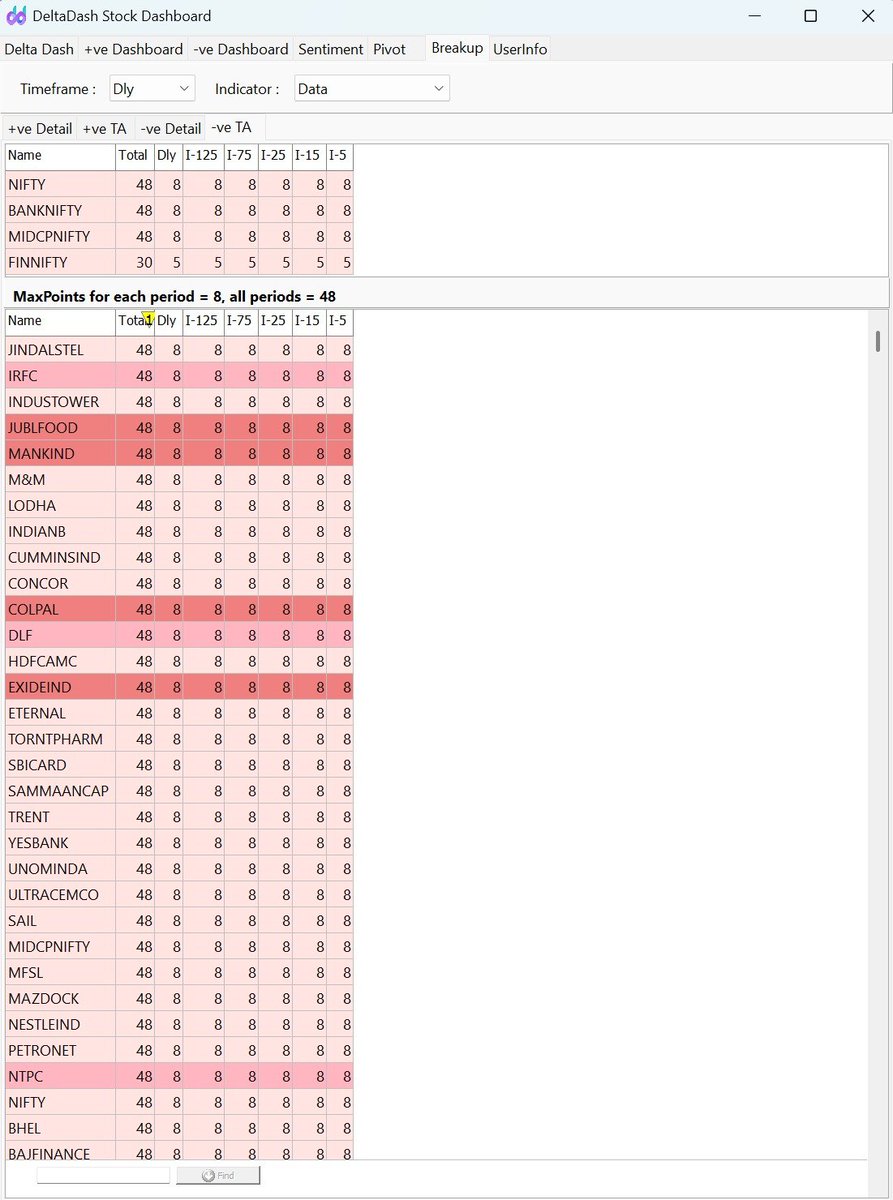
1st of it’s kind softwar that turns Indicators & OI in to SCOREBOARD. Software screenshots posted are past data for educational purpose only. Don't act on it.
📊 Weekend Homework = Better Monday Trading
Instead of searching for 10 different indicators, use one smart scoring system.
Delta Dash filters stocks using 100+ data points and ranks them based on strength.
🎯 Save Time
🎯 Reduce Noise
🎯 Focus on High-Probability Setups
Prepare today. Perform tomorrow.
📞 Demo: Mr.Mahek Shah – 9227198772
#DeltaDash #Trading #FNO #Nifty50 #BankNifty #StockMarketIndia
@deltadashboard@SpiderSoftIn
Most traders use 5–10 indicators on a single timeframe.
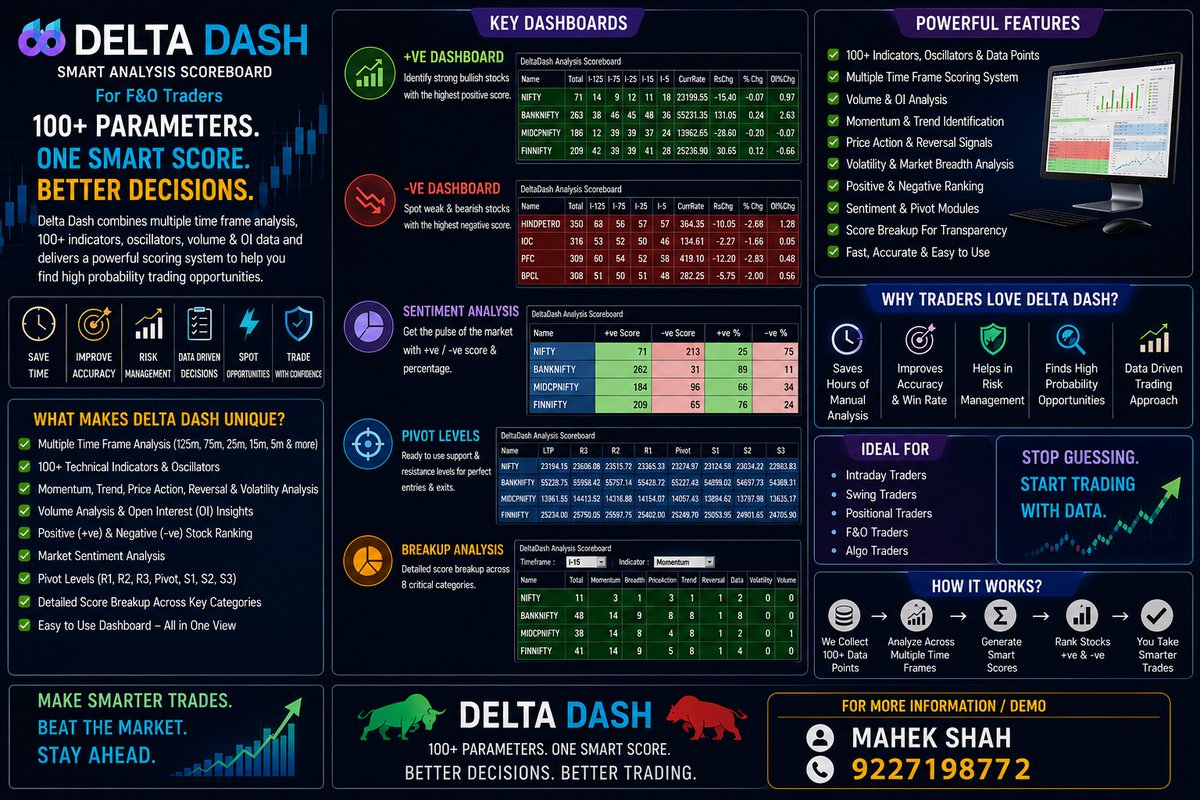
Delta Dash analyzes 100+ parameters across 6 timeframes and converts them into One Smart Ranking Score for F&O traders.
📈 Multi Time Frame Analysis
📊 100+ Indicators + Volume + OI
🎯 Bullish & Bearish Rankings
Trade Smart. Trade Ranked.
📞 Mahek Shah: 9227198772
@SpiderSoftIn@deltadashboard
#DeltaDash #FNO #Nifty #BankNifty #AlgoTrading
No theory is ever 100% in the markets—but when a view has already played out 2 out of 4 times, it deserves attention.
After NIFTY & Dow
Now the same setup is emerging in these 2 stocks.
Let’s see if the pattern delivers or throws a surprise. Markets always keep us humble 📊
WIPRO Insight 📊
Before mid-2022, price showed large deviations from the 200 DMA (see instances 1 & 2).
Post-2022, these deviations have narrowed significantly (instances 1, 2 & 3).
Now, price has again slipped below the 200 DMA with a deviation similar to recent patterns. (See instance 4)
👉 If this behavior holds, downside may be limited and price could mean-revert towards the 200 DMA.
No certainty—just a pattern to track. Let’s see how it unfolds.
📈 Déjà vu in the charts — and we love it.
The same analysis we ran in Sept 2024 on Nifty delivered results…
and now, applying that very framework to the Dow (Dec 2025) — it’s already moving in the direction 🎯 🔁📊
https://t.co/qVH1y82uUx
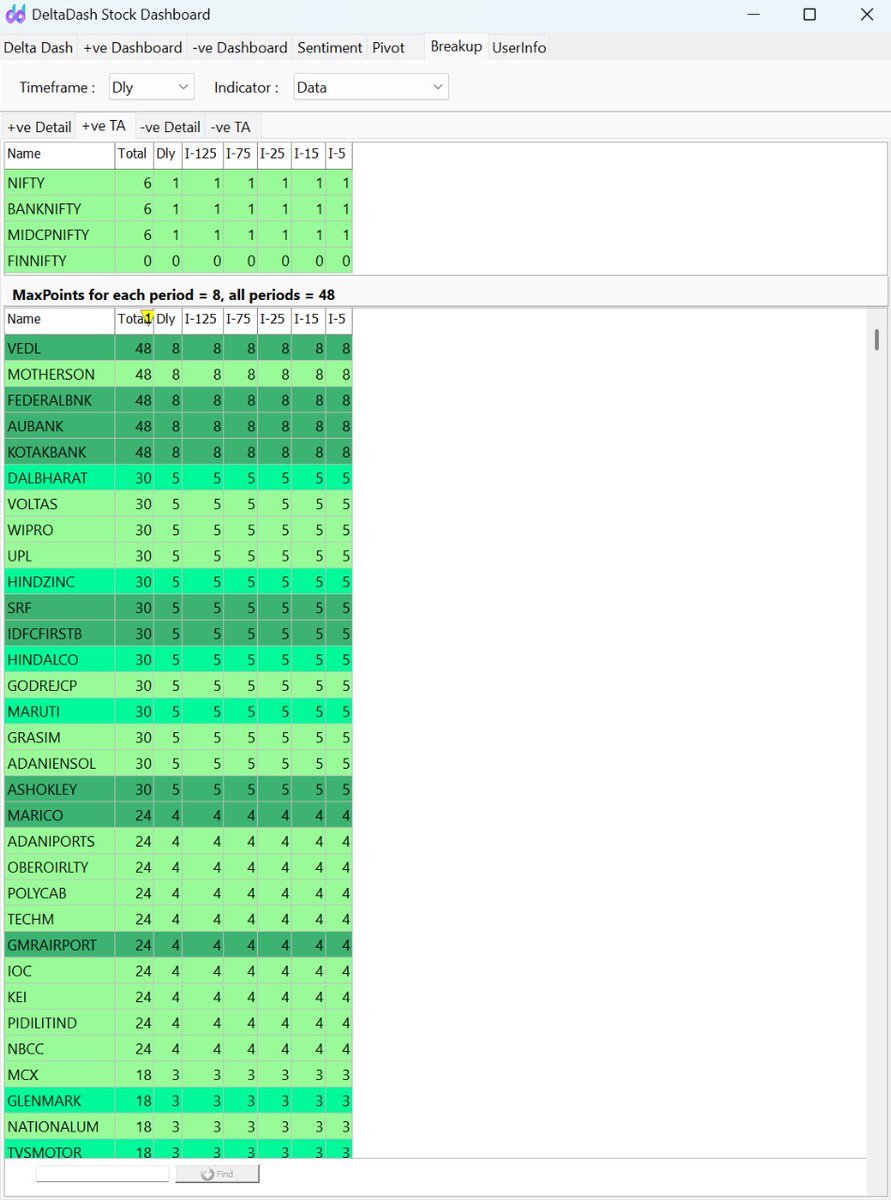
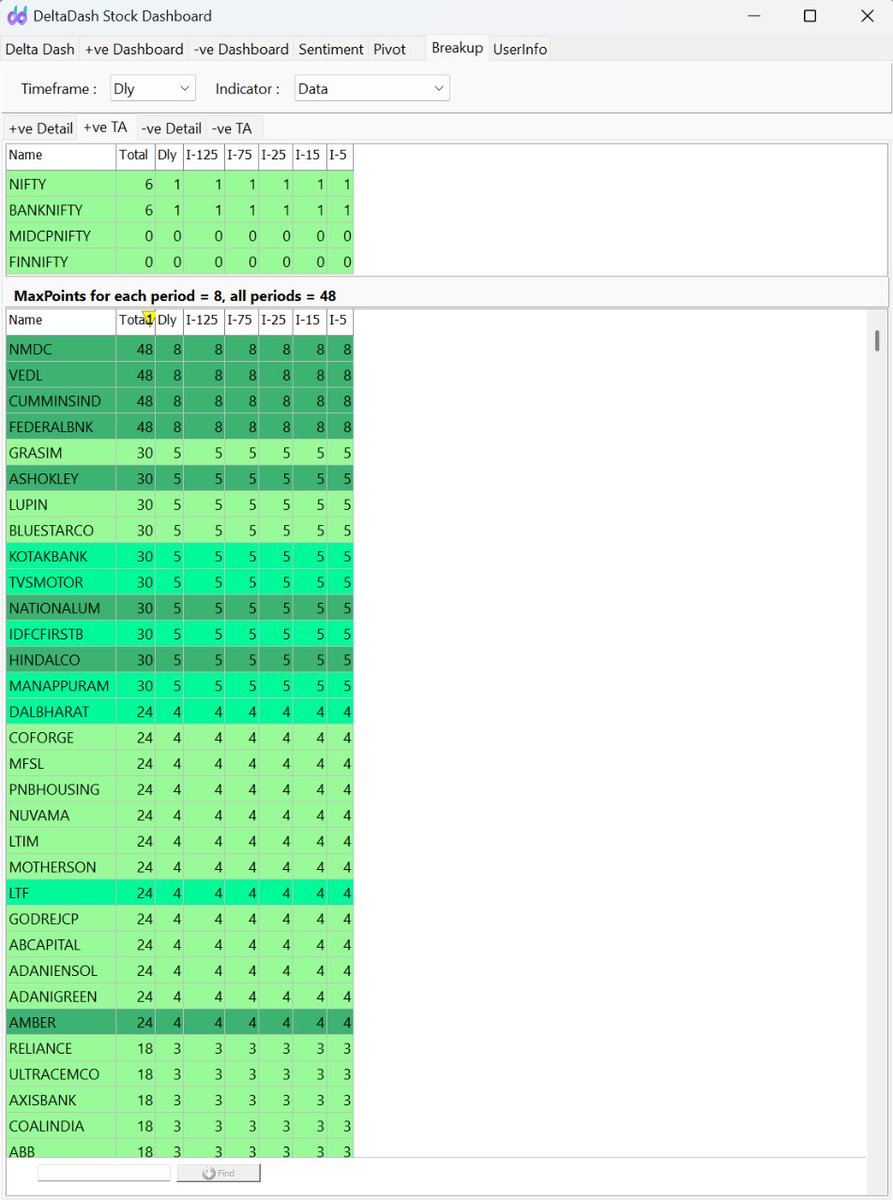
"Data Tab" suggests derivative data scoring out of total score of 8. Thus more than 5 score is better either for bullish or bearsh stocks. 1st-Top10 and 2-nd Top10 stocks based on their scoring are shown with their respective background.
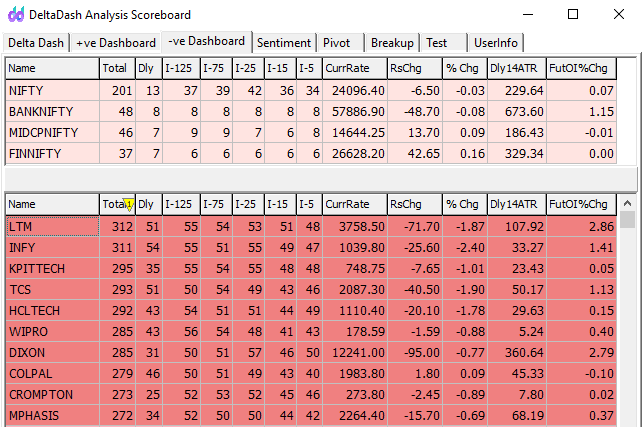
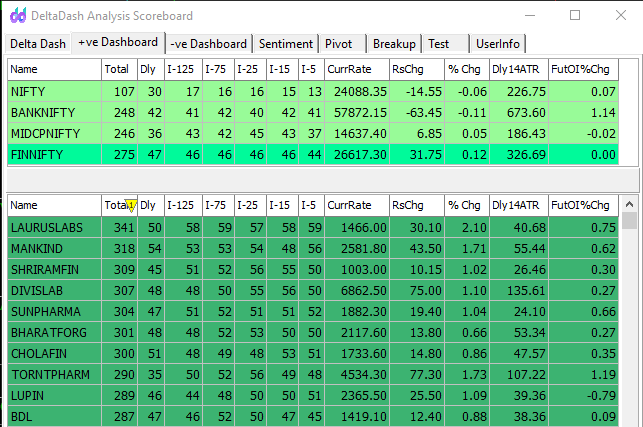
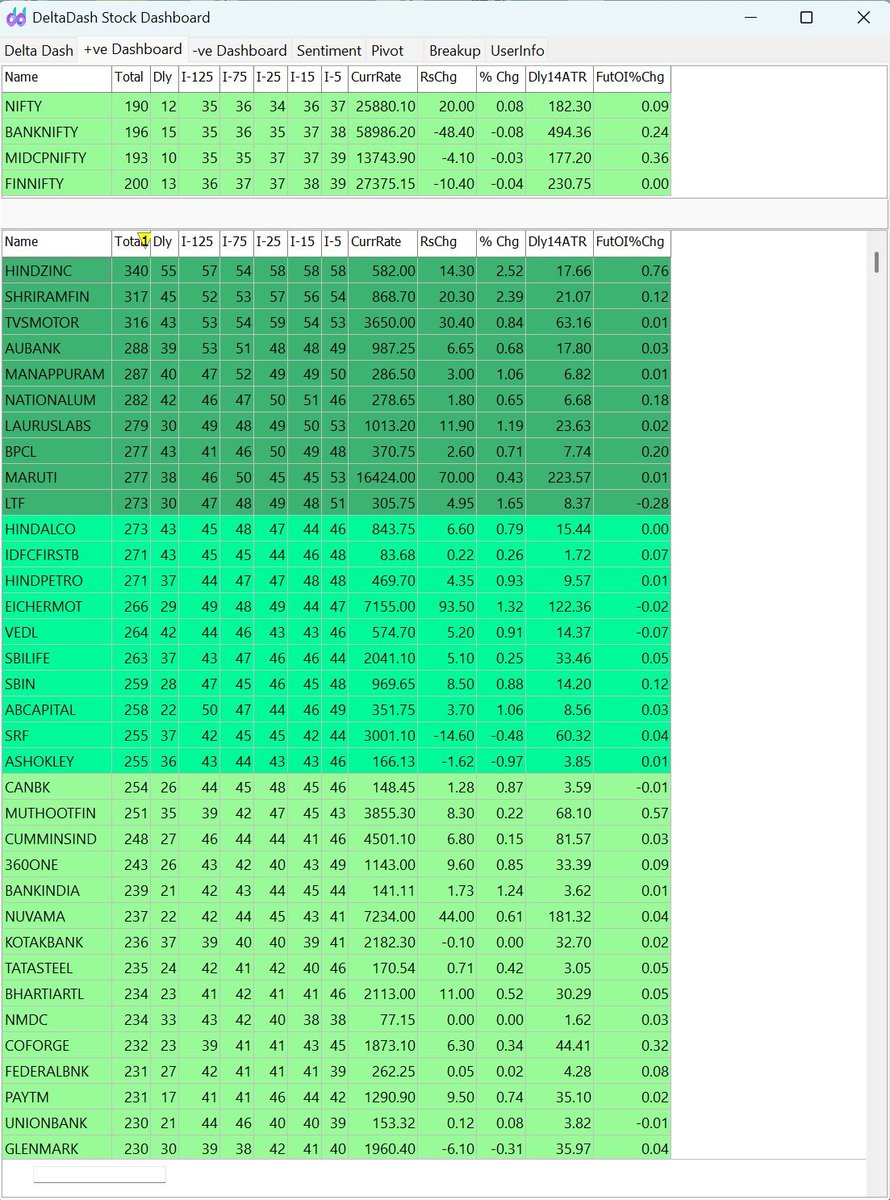
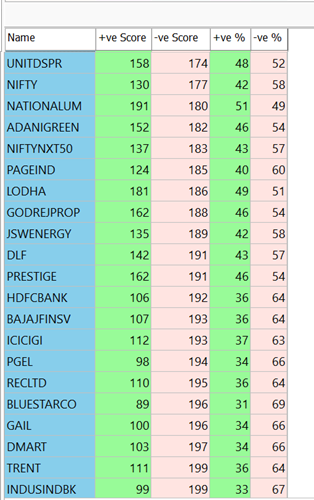
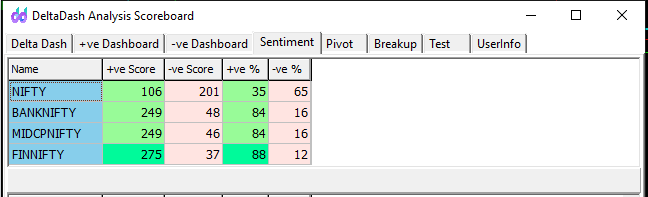
DeltaDash software makes Mkt reading this simple. Here are the screens at around 9:20am. Sentiment tab suggest the Bullish or Bearishness in "%" terms from the scoring. +VE dash board suggests 1st Top 10 stocks in dark color background. 2nd Top 10 in slightly less dark color.
"I-5" is intraday 5min scoring. "I-15" is intraday 15 min scoring. "Dly" is daily chart score. Thus, total 6 time frame scoring out of each 100 and total out of 600 is shown in both +Ve and -Ve dashboard. Thus, an extensive scoring is done based on different technical parameters.
"Data Tab" suggests derivative data scoring out of total score of 8. Thus more than 5 score is better either for bullish or bearsh stocks. 1st-Top10 and 2-nd Top10 stocks based on their scoring are shown with their respective background.
DeltaDash software makes Mkt reading this simple. Here are the screens at around 9:20am. Sentiment tab suggest the Bullish or Bearishness in "%" terms from the scoring. +VE dash board suggests 1st Top 10 stocks in dark color background. 2nd Top 10 in slightly less dark color.
"I-5" is intraday 5min scoring. "I-15" is intraday 15 min scoring. "Dly" is daily chart score. Thus, total 6 time frame scoring out of each 100 and total out of 600 is shown in both +Ve and -Ve dashboard. Thus, an extensive scoring is done based on different technical parameters.
"Data Tab" suggests derivative data scoring out of total score of 8. Thus more than 5 score is better either for bullish or bearsh stocks. 1st-Top10 and 2-nd Top10 stocks based on their scoring are shown with their respective background.
DeltaDash software makes Mkt reading this simple. Here are the screens at around 9:20am. Sentiment tab suggest the Bullish or Bearishness in "%" terms from the scoring. +VE dash board suggests 1st Top 10 stocks in dark color background. 2nd Top 10 in slightly less dark color.
"I-5" is intraday 5min scoring. "I-15" is intraday 15 min scoring. "Dly" is daily chart score. Thus, total 6 time frame scoring out of each 100 and total out of 600 is shown in both +Ve and -Ve dashboard. Thus, an extensive scoring is done based on different technical parameters.
"Data Tab" suggests derivative data scoring out of total score of 8. Thus more than 5 score is better either for bullish or bearsh stocks. 1st-Top10 and 2-nd Top10 stocks based on their scoring are shown with their respective background.
DeltaDash software makes Mkt reading this simple. Here are the screens at around 9:20am. Sentiment tab suggest the Bullish or Bearishness in "%" terms from the scoring. +VE dash board suggests 1st Top 10 stocks in dark color background. 2nd Top 10 in slightly less dark color.
"I-5" is intraday 5min scoring. "I-15" is intraday 15 min scoring. "Dly" is daily chart score. Thus, total 6 time frame scoring out of each 100 and total out of 600 is shown in both +Ve and -Ve dashboard. Thus, an extensive scoring is done based on different technical parameters.