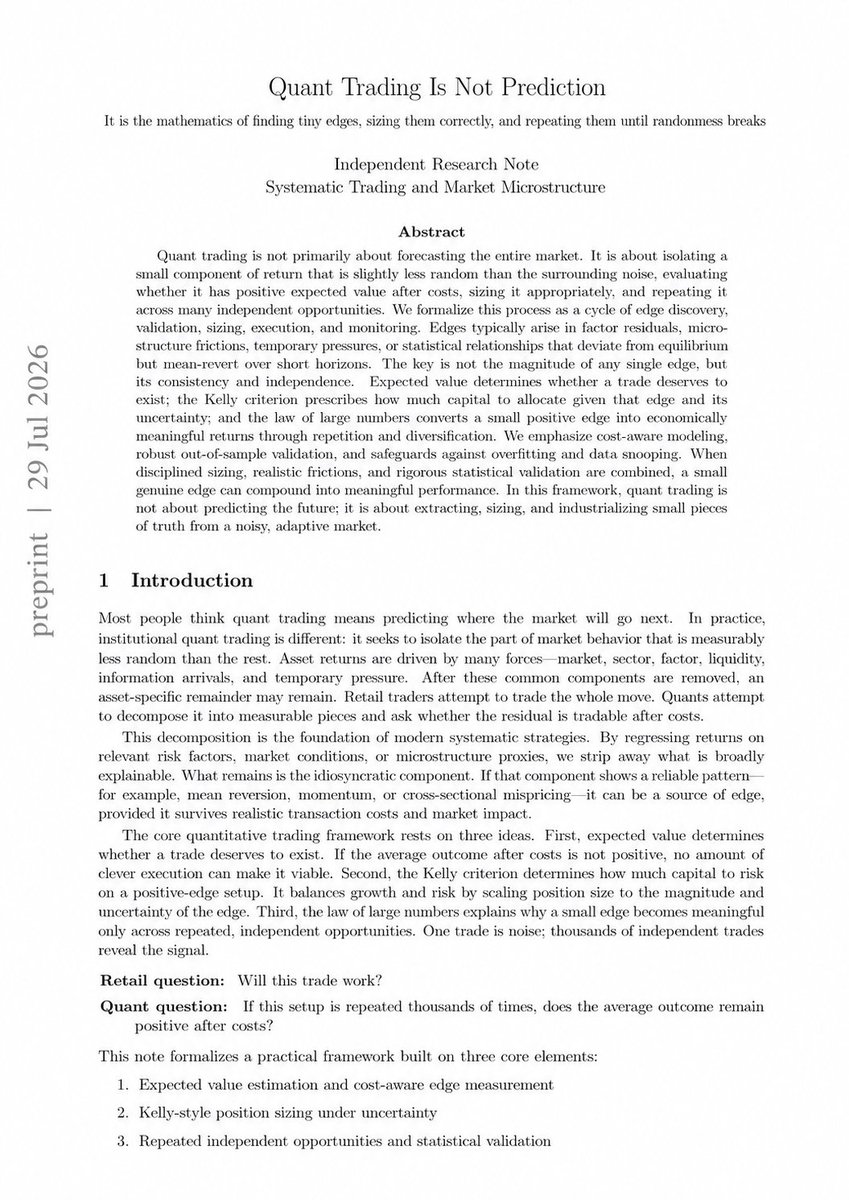
this Stanford paper is f*cking insane
it's about as close to an HFT desk as I've ever seen made public.
14 pages, top-tier signal combination, a full statistical framework.
the same framework I broke down in 11 steps in the article below - serial demeaning, cross-sectional normalization, residual weighting, empirical Kelly.
the crazy part is most people call the market right and still lose money, simply because they never came across these 14 pages.
read it first, then read the article.
bookmark before this thread gets buried.
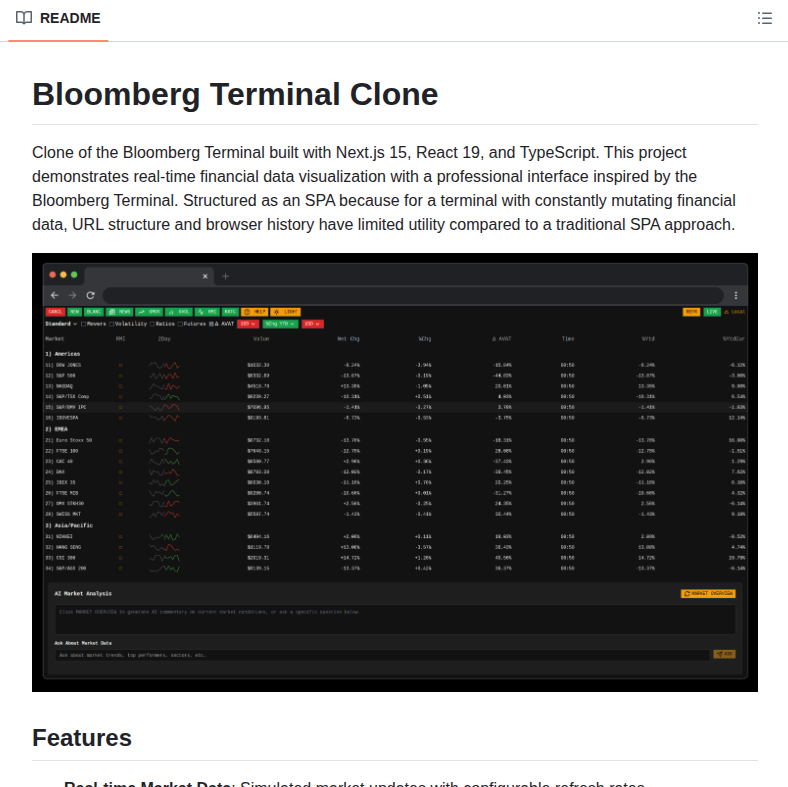
10 AI Trading GitHub Repos You Should Have on Your Radar
AI is moving into trading — from LLM-powered analysts to reinforcement learning and automated quant research.
If you're interested in AI + finance, these 10 open-source repos are worth exploring.
1. TradingAgents
A multi-agent LLM framework that simulates a trading firm with specialized analysts, traders and risk-management agents.
🔗 https://t.co/hhjynaYZaJ
2. FinRL
An open-source financial reinforcement-learning framework for training AI agents on trading and portfolio-allocation tasks.
🔗 https://t.co/WEb7CnW99e
3. FinRL-X
An AI-native quantitative trading infrastructure combining ML, reinforcement learning, LLM-ready workflows and risk controls.
🔗 https://t.co/eKY7OMs9TE
4. Qlib
Microsoft's open-source AI-oriented quantitative investment platform for research, modeling and strategy development.
🔗 https://t.co/t7WXsD89jq
5. FinGPT
An open-source financial LLM project focused on financial sentiment analysis, prediction and other finance-related AI tasks.
🔗 https://t.co/Pj4PFW7aYO
6. NautilusTrader
A high-performance algorithmic trading platform with backtesting, live trading and infrastructure for AI trading agents.
🔗 https://t.co/Tju00tlxOq
7. OpenBB
An open-source investment research platform that brings financial data and analysis tools into one ecosystem.
🔗 https://t.co/Ipqt84BS1C
8. FinMem
A research project exploring memory-augmented LLM agents for financial decision-making and trading.
🔗 https://t.co/GAJ2ExR3Aw
9. FinAgent
A multimodal financial AI agent that combines financial information with visual market/chart analysis.
🔗 https://t.co/AkcXFNJb9i
10. VectorBT
A fast Python framework for quantitative research and vectorized backtesting of trading strategies.
🔗 https://t.co/9HkQoGraCw
All open source.
AI + Finance.
Research + Trading.
Save this list — the future of quantitative trading is getting increasingly AI-native.
i genuinely don't understand why everyone isn't doing this yet, as wall street guy himself leaked this on reddit.
he shared the framework their hedge fund used that survived regime shifts with all technical details openly and now anyone can vibe code it.
Save this before it disappears.
Here is my scanning routine and process I follow to trade my breakout system at the end of the day.
This is the SAME routine (and polished-out version) of my daily process which I run to:
-> get multiple 100%+ years since 2020 (shown in track record)
-> avg +50% CAGR since 1995 (with my 10k+ signal database as outsample)
->entering breakouts at EOD,
-> and just trading 20min/day
It's very simple; all I do is:
• Go to TradingView
• Open the regular stock scanner
• narrow down the universe with the selections in the video below
• move those results to another WL
• then run my custom Pine screener
• shows me 5-25 stock results
• manually verify stocks meeting my criteria
• load them up on my broker
• enter at 3:58 EST before the close
The pre-selection scans on the US stocks universe is:
- price >= 1
- price x avg dol volume >15M
- 8 EMA > 20 EMA > 50 EMA
- price > 20 EMA
- ADX >30
- ADR % >= 1%
The point here is to make a filtered universe of stocks to THEN run my PINE screener, so it can get the whole universe below 1k stocks so it fits the WL size in TV.
My custom Pine screener then searches for:
- Stock already established momentum + in consolidation state
- CML is green
- adjusted avg $ volume to >20M
- the current consolidation has a defined HL (for longs, LH for shorts) showing VCP characteristics
- the consolidation is at least 7 candles in length
- A breakout candle above the high of previous day candle
- entry to stop size is >1.2% (for position sizing rule)
- and some other specific criteria to dial in the possible breakouts like defined swing points, volatility contraction, etc
The result?
In just <10 minutes I scan the whole universe of US stocks, get 5-25 stocks that meet my strict criteria for trading momentum breakouts, and I just load the orders and enter before the close.
THIS is a simple, quite polished, daily process and routine I follow to see my edge play out overtime.
Remember, scans and the daily process is JUST a tool to execute your syste/setup the most efficient way possible.
If you feel lost during the day, and feel like "winging it" constantly, revise your setup, define what you are looking for, and build a polished and efficient routine to make it happen and minimize mistakes.
Trading only rewards the prepared, get to work and make it happen 📈
YuanYuan Xu, one of the sharpest young Chinese mathematicians working in probability:
"PDT Partners pays a math PhD $500,000 a year for one skill: proving when a winning streak is real edge and when it is just luck. that proof is the exact thing this mathematician writes on a chalkboard, and it costs nothing"
this free lecture is the math that tells you whether your edge is real or you are fooling yourself.
strip away the P&L screenshots and one question decides everything. after N bets, how far can your results drift from your true win rate by pure chance.
there is a precise answer. it is called a concentration inequality, and it puts a hard bound on how much luck can flatter you or wreck you over a run. it is why 10 wins prove nothing and 10,000 prove almost everything.
Xu builds it from zero, on a chalkboard in Brazil, in notation a beginner can follow. a Chinese mathematician handing out the exact tool funds use to tell skill from noise.
Wall Street rents this out as a $500,000 edge. a mathematician at a chalkboard hands you the proof in English for free.
this quant paper is f*cking insane
a former Morgan Stanley quant who later started his own hedge fund just released the whole thing.
224 pages, and it's not theory, it's the actual trading strategies with every line of code included.
the crazy part is this level of detail almost never leaves a fund, let alone gets published for free.
if quant trading has been on your radar but you had no idea where to start, this is probably the best entry point.
bookmark it now before it gets buried.
Jane Street fired this guy who leaked their method to build regime aware trading agents.
he openly shared this guide on reddit that got 40k upvotes.
Bookmark this before its lost.
Here is a full breakdown of my EOD swing trading system that:
- Gave me 100%+ years since 2020
- Averages +50% CAGR since 1995 (based on 13k signal database)
- Entering breakouts EOD (2-min before the close),
- and trade 20min/day, with no discretion, and no stress
I will use an example of a trade I closed yesterday in $BMY, following the 5 steps in the pic attached.
---
Step 1:
The first thing to trade momentum breakouts is to find stocks that made a new, fresh leg higher and established a new trend.
I use the 50 EMA cloud (with 0.5 ATR 5 period above and below) as a base, when the market prints a strong first leg coming from this area, it means that it's the FIRST fresh new leg of an intermediate-term trend, and the price/time relationship in the higher time frames has been corrected, and we are EARLY.
It's very important that it's the first leg and fresh; stocks that already had consolidations and are trading in their 3rd and 4th legs of the intermediate trend have a lower chance of having a successful, multi-day breakout.
I've tested this big time, and first consolidations after first legs have a much higher success rate % over later stage consolidations:
-> The later into the trend, the more extended it is, the biggest risk of a stop-out.
---
Step 2:
Then the stock will get in what I call the "perfect uptrend state", which signals when:
• The 8, 20, and 50 EMAs are stacked up and trending, and
• my CML indicator is GREEN (signals a perfect blend of momentum + linearity in a stock, looking at candle overlap for linear moves)
At this point, the stock will be hitting my breadth scans, as we have those stocks in an ABSOLUTE state of momentum, and that's when they give the highest quality consolidations against the 8/20 EMAs to look for a breakout.
---
Step 3:
--> Look for the first valid volatility contraction pattern, riding the 8/20 EMAs layer.
This is the step before the breakout, and you want to see the volatility contract, with the top and bottom trendlines converging together.
This shows that in the case below, sellers are being absorbed, and buyers are about to break through the least amount of resistance, taking prices to major levels quickly.
That's the foundational principle of the volatility contraction/expansion cycle, and we want to find these stocks about to make the expansion leg in the direction of the established momentum (or uptrend).
What to look for in a high-quality consolidation here:
> at least 7 candles of consolidation before a breakout
> no close below the 20 EMA
> see VCP characteristics (mainly a higher low for longs)
> swing points should be defined to draw trendlines OR a horizontal line to trade from ( triangles and ascending triangle shapes only)
---
Step 4:
Now look for the breakout candle, breaking through resistance, and having a nice close.
Some things I want to see here are:
- strong body candle signaling buying into the close
- body of the candle should be bigger than yesterday's candle
- should be closing in upper range of the candle (marked by the 0.786% level most of the times)
- for longs, stop loss size should be <= 2.5x ADR or ATR% for the last 20 days (to keep risk-reward in check)
- Stop goes @ LOD, entering just before the close at 3:58pm EST
---
Step 5:
--> After the breakout, I ride the swing for 5 days, regardless of what happens.
I've tested exits for my momentum breakouts from consolidations with over 13k signals as a database (including my live trades since 2020), and nothing beats a 5-day hold.
I might have different trade management according to my timing model, which is not the scope of this post, but I can have for longs:
- FULL LONGS ( 🟢 light) = exit at the 5th day full position
- LONGS + PARTIALS (🟡 light) = take 40% partial at 1:1 RR, ride the rest until the close of the 5th day.
My timing model is based on lots of breadth-risk parameters, will get into that later on.
---
That's all I do, and I've been doing it for years now. You can check my track record since 2020, and I also manually gathered 10k+ signals in my Strategy Hub App (inside the community), which shows how my strategy performs since 1995.
I trade with hard rules, no discretion, and follow my daily process to scan -> identify -> enter trades in the last 20 min of the trading day.
You do NOT need to be hours in front of the charts, looking for trades, or making emotional, reactive decisions.
You need:
- a strategy
- a daily process
- base it EOD to be done in 20min/day
You can have a life outside trading while still compounding at 50%+ CAGR with low drawdown, which is the whole point of this.
If anything resonates with you, check out my pinned post in my profile with a 4hr+ masterclass on my setup, expanding everything I shared here.
Go and do the work.
You only have to do it once 📈
I took one of the most well-known academic strategies in quant finance and asked AI to recreate it.
I'm talking about Time Series Momentum (Moskowitz, Ooi & Pedersen, 2012), one of the most cited papers in systematic trading.
I uploaded the paper to Horizon and asked it to build a trading strategy without writing a single line of code.
The model:
> implemented multi-horizon momentum (21 / 63 / 126 / 252-day lookbacks);
> normalized signals using volatility;
> automatically generated long and short positions;
> ran a backtest with commissions and slippage.
Backtest results:
> +434.3% Total Return
> 29.5% CAGR
> Sharpe Ratio: 0.82
> Profit Factor: 1.75
> Max Drawdown: 61.8%
For comparison, Buy & Hold returned approximately +119% over the same period, with a maximum drawdown of 84%.
The most interesting part is that the strategy won only 28.9% of its trades, yet the average winning trade was 5.48× larger than the average losing trade. That's one of the defining characteristics of classic trend-following strategies.
It's impressive to see how AI can now take ideas from academic papers, turn them into a clear set of trading rules, and validate them on historical data in just a few minutes.
Horizon: https://t.co/ki213YmaOX
A member of my community posted this strategy over a year ago. Everyone scrolled right past it.
Today i finally backtested it properly: 8.5 years of NASDAQ data, real spreads, real commissions.
+103% return. 12.9% max drawdown. 2,043 trades.
Then i tried to break it.
I tested 86 different parameter combinations.
Every single one was profitable.
The win rate? 49.93%.
Basically a coin flip.
The entire edge comes from one exit rule that most traders refuse to follow.
The new video shows the exact rules, plus the Claude prompt that recreates the strategy in under two minutes with zero coding.
It's also trading live on the channel right now in a 24/7 livestream, with an AI agent answering questions in the chat while the strategy runs.
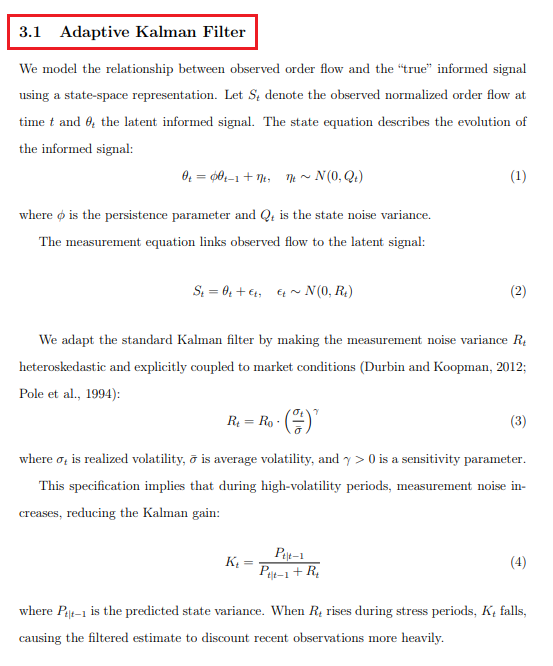
The most profitable equation in a history of hedge funds:
Rt = R0 × (σt / σ̄)^γ
It makes money by ignoring noise.
Bookmark this and then read the article.
🚨BREAKING: Claude can now build a instagram page from scratch — and hit monetization in just 90 days.
There is a Massive opportunity right now to make influencer money without ever showing your face. Less then 1% of the 3Billion people on instagram every month are making content. There is no other market in the world with such high demand and little competition. Brands are paying me $3k-13k every single month. I do all of this while I run my full time property management company.
It takes 1-2 hours a day in the beginning and 30 min after 6 months.
If You Want to Finally UNDERSTAND how to use GAMMA EXPOSURE (GEX) , just Imagine Walking Into a Bread Shop🥖
A introduction to how to ACTUALLY trade with GEX
Every morning on your way to work, you stop by the same neighborhood bakery.
For days, you've noticed the baker puts exactly 10 loaves of bread on the shelves before opening. It's consistent. Every day, there are 10 loaves available for customers to buy.
Then one Sunday, something changes.
Instead of putting out 10 loaves, the baker stocks 100 loaves before opening.
That should immediately catch your attention.
Why?
Because the baker is increasing the amount of product available for customers to purchase. He has supplied more inventory because he expects more demand. If he didn't believe more customers were coming, there would be no reason to fill the shelves with ten times as much bread.
Now think of the baker as the market maker.
The bread is liquidity.
The customers are traders.
When Daily Net Gamma increases, market makers are doing something similar. They are increasing their long gamma exposure, which adds liquidity to the market. Just like the baker stocked more bread, market makers are supplying more liquidity because they anticipate increased buying activity.
Now imagine the opposite.
You walk into the bakery expecting the usual 10 loaves, but instead there are only 5.
The baker hasn't run out of bread by accident. He's chosen to supply less inventory because he expects fewer customers.
He's reduced the amount of product available.
That reduction tells you something about his expectations.
The same principle applies to Daily Net Gamma.
When Daily Net Gamma decreases, market makers are reducing long gamma or increasing short gamma, removing liquidity from the market. Just as the baker stocked fewer loaves because he expected less demand, market makers are supplying less liquidity because they expect weaker buying.
I use it to understand what market makers are expecting.
An increase in Daily Net Gamma tells me dealers are adding liquidity, creating a more supportive environment for bullish price action.
A decrease tells me they're removing liquidity, creating an environment where bullish moves have less support and downside risk becomes more likely.
The final step is confirmation.
Just because the baker stocked 100 loaves doesn't guarantee customers will buy them.
You still have to watch people walk through the door.
In the market, that's Net Volume.
If Daily Net Gamma is increasing and Net Volume begins expanding positively, market makers' expectations are being confirmed by actual buying.
If Daily Net Gamma is decreasing and Net Volume turns increasingly negative, the reduction in liquidity is being confirmed by selling pressure.
Daily Net Gamma tells you what the market maker expects.
Net Volume tells you whether the customers actually showed up.
When you understand the relationship between those two, you're no longer guessing where the market might go. You're reading the expectations of the market makers and waiting for traders to confirm them.
this quant trading framework is f*cking insane
the best funds are not trying to predict where the market goes next
they isolate tiny mispricings, size them correctly, and repeat them until randomness stops mattering
the crazy part is a 51% win rate can be enough
positive expected value finds the edge
kelly criterion controls the risk
the law of large numbers turns it into a business
one trade means almost nothing
10,000 correctly sized trades can build an entire machine
bookmark before you waste another year trying to predict every candle
Choongbum Lee, MIT, from the lecture on the random walk behind every stock price:
"Citadel pays $900K to price randomness, not predict it. one lecture: a stock is a random walk, and you sell the range, not the call."
this free MIT lecture is the exact model those firms are built on, the one assumption most people never realize they are betting their life on.
here is the strange part. the math started with pollen. in 1827 a botanist watched dust twitch in a drop of water with no cause. a century later that same jiggle, the random walk, became the accepted model for a stock price. each step tiny, each one unpredictable, no memory of the last.
Lee builds it from a coin. flip it forever, stack the wins and losses, and you get a path that wanders with no destination. that is your stock. you cannot say where it goes tomorrow, and that is not a flaw in the model. that is the model.
it is also why the trillion-dollar equation works. Black-Scholes does not predict the price. it gives up on prediction entirely, then prices the full range of where a random walk could land. you stop guessing the future and start charging for the uncertainty of it.
that is the move nobody teaches you. the amateur tries to be right about direction. Citadel assumes direction is unknowable and sells that unknowability for a fee, millions of times a day.
the random walk has been free at MIT for over a decade. the leap, to stop predicting and start pricing the randomness itself, is the only part anyone ever paid for.
HOW TO ANALYZE DIFFERENT MARKET SECTORS & FIND SECTOR ROTATION🔄
This is one of the most important concepts for beginner traders to understand. The market moves in cycles. Money flows from one area to another
Here's a simple breakdown:
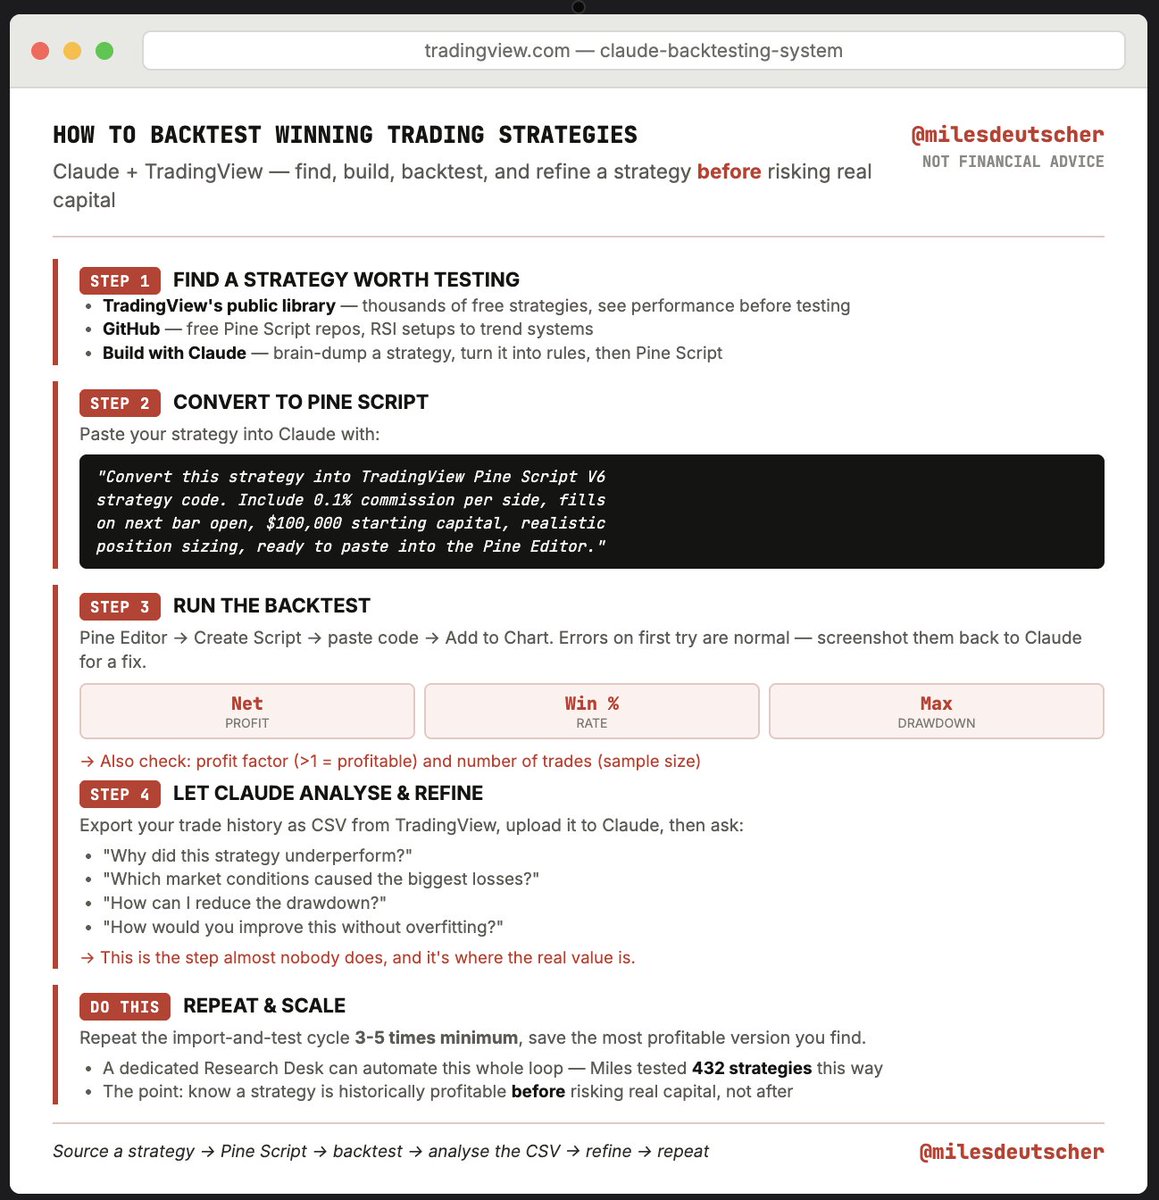
Claude + TradingView is a complete cheat code.
99% of traders don't know this, but with this combo, anyone can find WINNING trading strategies.
How to find strategies, convert them into Pine Script, import them into TradingView & more: