DensityDesign is a Research Lab of the Politecnico di Milano. It focuses on the visual representation of complex social, organizational and urban phenomena.
@rawgraphs' mission is simple: to provide a free, open-source, up-to-date visualization tool for everyone.
Help us keep the project alive by becoming a sponsor!
Why supporting RAWGraphs by becoming a sponsor?
✅ it's open source
✅ it's free
✅ it doesn't require any account/signup
✅ It doesn't store your data
✅ a wide range of charts
✅ you can export the visualization in svg
Donate here https://t.co/8HCLtiR5vK
New event 📅 "The multimodal circulation of misleading infovis on social media platforms"
@elena_aversa from @densitydesign is visiting us in the Digital Media Lab next week✨
She will present her work at a lunch seminar, details here: https://t.co/6QmXCWJV63
We opened the "Api, Glicini, Cemento" exhibition on Wednesday at @meetcenter. It's been an intense journey! This year, we shared with a broader audience what our students found online through their data-driven catalogues and multimedia installations.
🐝🌿◻️ The exhibition explores eight hyper-local debates generated by policies safeguarding biodiversity and urban interventions questioning the relationship between a city's need to change and preserve ecological systems. More info at https://t.co/Nhevlm1pHZ
Save the date! February 21st at 18:30, we will open the exhibition, "Api, Glicini, Cemento", with the students of the Final Synthesis Studio at MEET in Milan. To join us, sign up at this link https://t.co/XItgfbxGqW
✨Join us on Tuesday at 6 PM at Bovisa Campus for a captivating showcase of Infopoetries crafted by students in our Final Synthesis Studio. For those unable to attend on Tuesday, the exhibition will be on display until the 23rd of February. We look forward to welcoming you!✨
In the latest version of RAWGraphs, we have added the ability to load custom charts on the fly. You can code your own chart (or ask someone to code it for you), load it on the RAWGraphs web interface, and share it with others.
We're organizing a free webinar, more info here:
Are you a developer?
Do you like to play around with D3.js/Javascript?
We are preparing a free webinar to learn how to create new charts for RAWGraphs on November 24,from 14:30 CET
Registrations on Eventbrite
https://t.co/VcO9K5evoO
#Datavisualization#dataviz#opensource
Congrats to our former students M. Casarotto, Davide Chiappini, A. De Simone, E. Ghebaur, F. Gheli, H. Ma, and R. Riccardelli for being selected in the ADI Design Index with their project "A DATA-JOURNEY THROUGH THE INFODEMIC CONSPIRACIST UNDERGROUND." https://t.co/G752XbQIJ0
Marek Tuszynski, our Executive Director, is at @Kikk_Festival sharing insights into the GAFAM Empire project by @Info_Activism & @densitydesign that looks at the acquisitions conducted by 5 big tech: Google, Amazon, Facebook, Apple & Microsoft. More: https://t.co/a1hNZOTDFN
Yesterday Andrea Benedetto won the BestBook Award for the Design category at the ADI Design Museum in the V Biennale Oggetto Libro! His #infopoem, developed during our course, collects all the network requests from his browser and publishes them in a book. https://t.co/AwbuJshIq0
in "My Digital Double and Me" @laramacrini used her Spotify #personaldata : each profile-tag is a prompt for AI to generate a face. The composite face reflects on big tech #profiling and us. Vote this #infopoem on the IIB shortlist (register to vote). https://t.co/Ejj3SkhvdT
@rawgraphs' mission is simple: to provide a free, open-source, up-to-date visualization tool for everyone.
Help us keep the project alive by becoming a sponsor :)
Why supporting RAWGraphs by becoming a sponsor?
✅ it's open source
✅ it's free
✅ it doesn't require any account/signup
✅ It doesn't store your data
✅ a wide range of charts
✅ you can export the visualization in svg
Donate here https://t.co/8HCLtiR5vK
Do you want to support RAWGraphs?
Become a sponsor on Github. You are free to make a one-time donation or support us with a recurring monthly donation. Every penny counts!
Read more here: https://t.co/imOZJHr8Hy
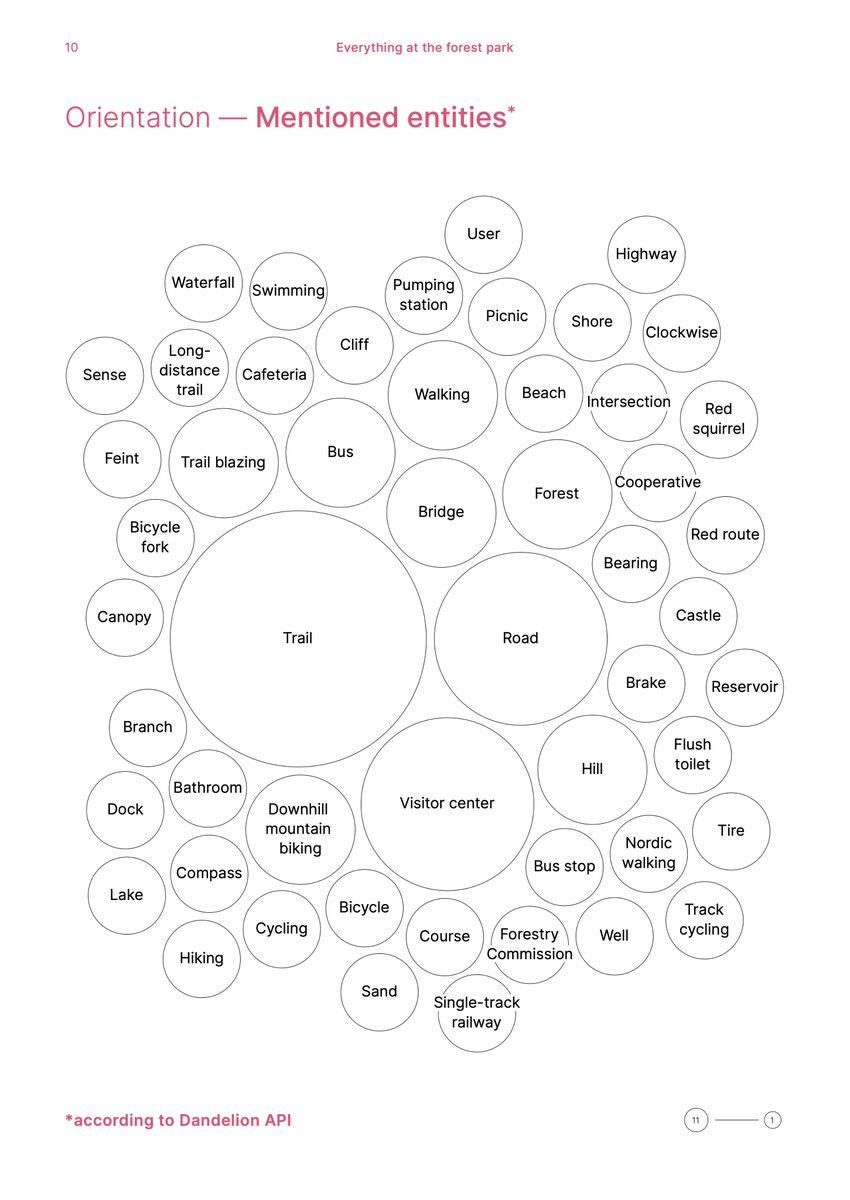
Just out with @jwyg: "Un-indexing forest media: repurposing search query results to reconsider forest-society relations". We put forward ‘un-indexing’ as a critical method for re-ordering search engine results to complicate digital perspectives on forest-society relations.
On Thursday, I will be presenting at @cesta_stanford the work and research we have done at @densitydesign on visual interfaces for digital archives. If you feel like stopping by, you are more than welcome! More info here👇https://t.co/BRPRubdhU9