Great to team up with @jeremotographs and @capitalandmain to highlight how health care policy changes impact millions of lives. Check out the data showing the number of uninsured rising by 2 million under Trump and dropping by 3 million under Biden
https://t.co/zsoLCFTx0Q
The number of residents without health insurance rose by 2 million under Trump, then fell by 3 million under Biden, but those coverage gains could soon be at risk. My latest for @capitalandmain
@hannah_recht@JoeMurph We rely on ACS data. Census warns against comparing experimental 2020 data to other years. The time periods attempt to isolate effects of pandemic on uninsured counts, and base years (eg 2019 for Biden rather than 2021) establish reference point before policy changes in each term
@sangerkatz Great to see @jeremotographs piece and the accompanying maps I created for @capitalandmain cited in the Harris campaign’s report! The updated maps with 2023 data show even larger gains under Biden
https://t.co/xoR8WTNkjT
https://t.co/0FSa528w8f
@datagogo@capitalandmain@CAPAction The bars start at zero to show net change during two distinct periods (Trump and Biden admins). Starting the blue bar at the top of the red bar would suggest a cumulative comparison across time, which is not the intent of the chart
More coverage of the big shifts in uninsured Americans from @USATODAY:
“Health care affordability…remains a critical issue for many Americans, with 57% describing it as a “very big problem,” according to a Pew Research Center survey released in May.”
https://t.co/IDJ0ujgFkP
Great to team up with @jeremotographs and @capitalandmain to highlight how health care policy changes impact millions of lives. Check out the data showing the number of uninsured rising by 2 million under Trump and dropping by 3 million under Biden
https://t.co/zsoLCFTx0Q
The number of residents without health insurance rose by 2 million under Trump, then fell by 3 million under Biden, but those coverage gains could soon be at risk. My latest for @capitalandmain
We found Indiana had high risk from private equity's influence in the housing market.
🏘️ % of homes purchased by medium, large, mega investors 𝟏𝟏.𝟏%
🏘️ Change in share of homes purchased by medium, large, mega investors 𝟐𝟎.𝟒%
(data from 2018-2022)
https://t.co/CJghNODNcV
Today, we launched the NEW Private Equity State Risk Index, a groundbreaking policy tool aimed at assessing the impacts of the private equity industry on all 50 states. https://t.co/MuMnvtsiWB
After a full year of data sleuthing/analysis for @PEstakeholder, it’s great to see the Private Equity State Risk Index released and in the wild! The index combines 16 measures to rank the PE risk to states’ overall economies, and separately to jobs, healthcare, housing, pensions
"The PESP state risk index shows some 17% of homes across Georgia have been purchased by medium, large and mega-investors, up 62% since 2018. Arizona and Nevada are also magnets for private equity and corporate landlords."
story by: @gmorgenson
https://t.co/QsTtP8U0Ln
The new Private Equity State Risk Index finds Indiana at ‘High Risk’ with a score of 67 (2nd most at-risk in the Midwest)
Among the findings: IN is among the top 10 states for the share of single-family homes recently purchased by corporate investors.
https://t.co/CzcBO40mnp
Today, we launched the NEW Private Equity State Risk Index, a groundbreaking policy tool aimed at assessing the impacts of the private equity industry on all 50 states. https://t.co/MuMnvtsiWB
Colorado is in a housing crisis. Check out our brand new data report at https://t.co/2MzkepzSgV about the state of housing in Colorado. It feels overwhelming, but there are practical, simple steps we can take now to lower housing costs for Colorado families. #coleg#copolitics
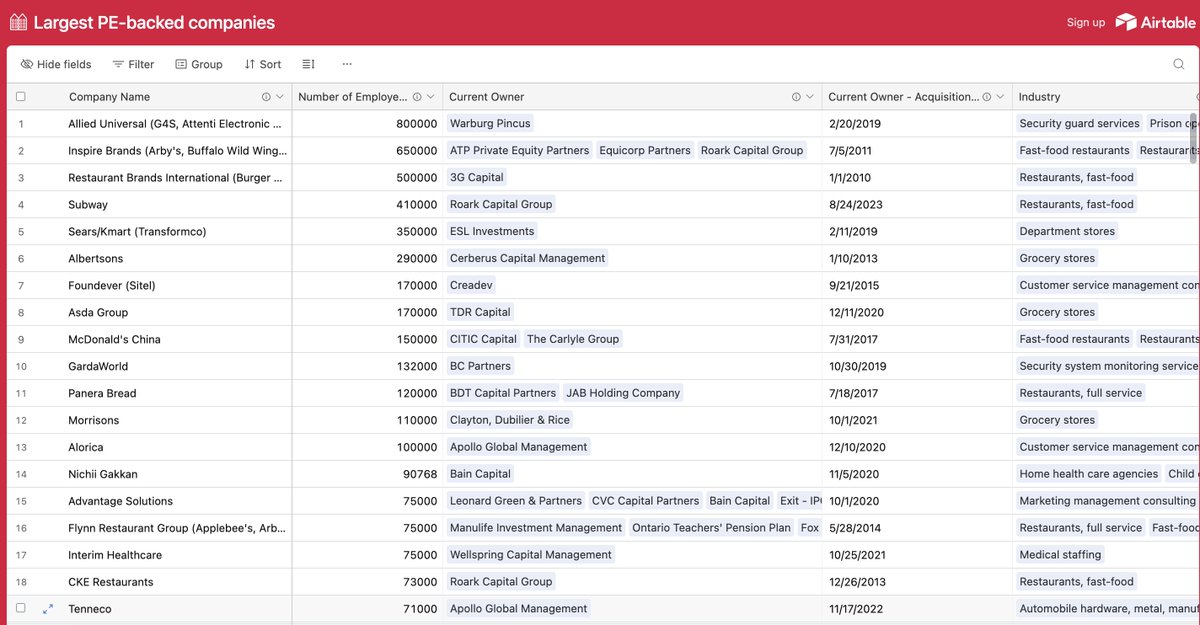
PESP's latest database contains information on nearly 200 private equity-owned companies with 10,000 or more employees. The table can be filtered and sorted by any of the columns such as "Current Owner" or "Industry."
https://t.co/lbc4UFpb47
🚨New Data Alert🚨
You can now download the Homeowner Assistance Fund, Economic Impact Payment, and pandemic unemployment insurance datasets from our website.
Check it out:
https://t.co/Y3DQ27vFio
A new tool—the ARP Data and Evidence Dashboard—offers a detailed look at how state governments are investing the first round of rescue plan dollars. https://t.co/Fk5nGao5cQ @Results4America@MathematicaNow#ARPA#NCSLnews