Study 📚
Candle Range Theory (CRT) is one of the cleanest and most powerful price action frameworks used by institutional aware traders.
At its core, CRT is Candle Range Theory method that identifies high probability zones by focusing on the precise range created by specific candle formations.
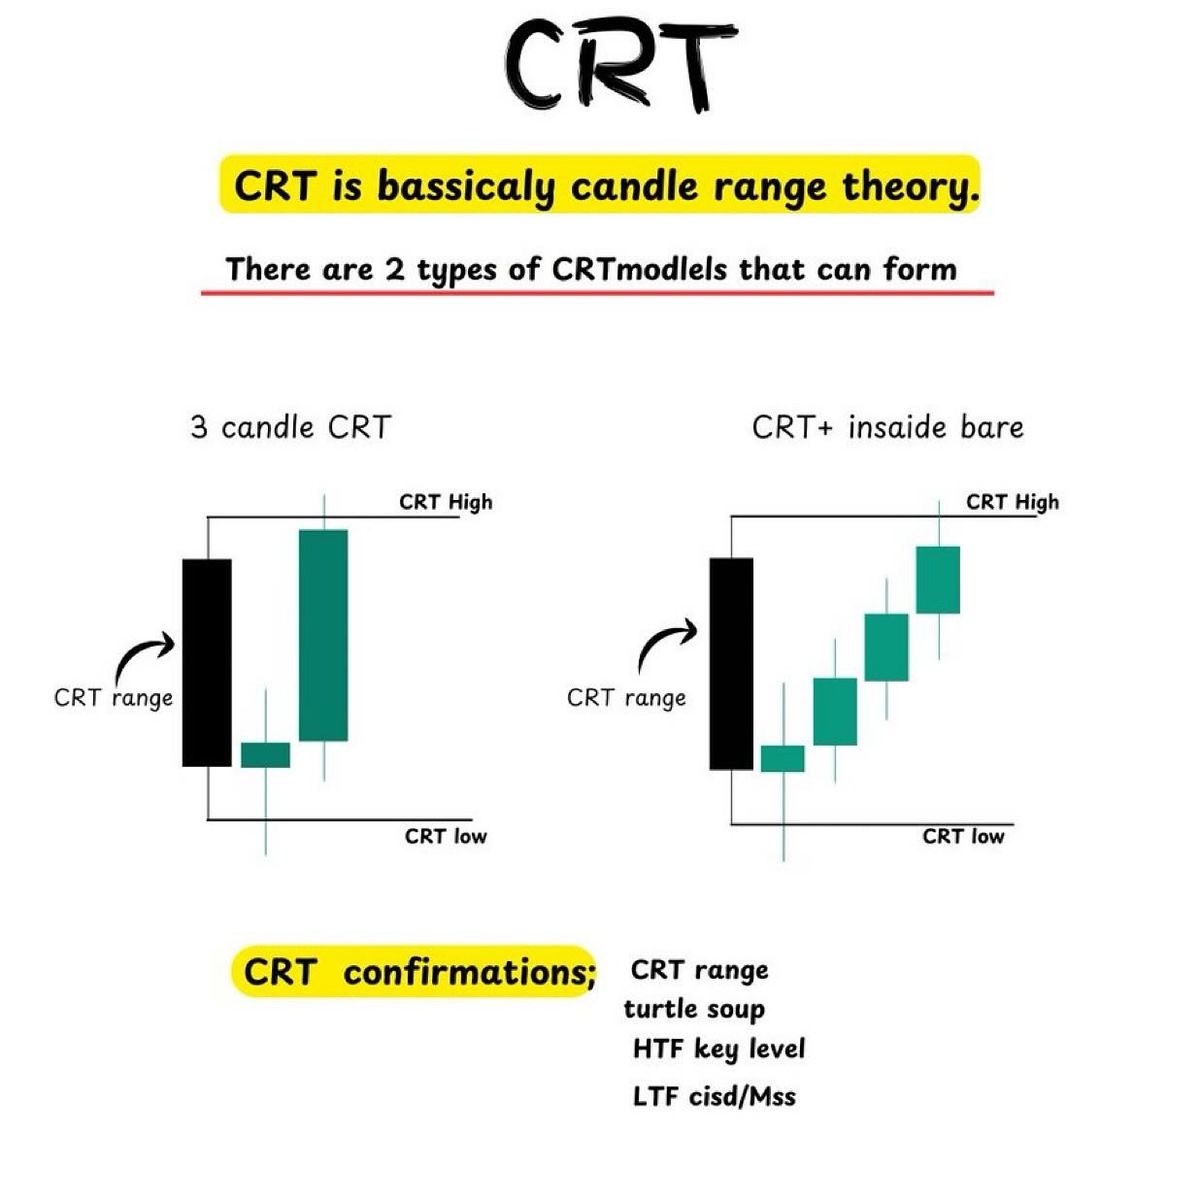
There are two primary CRT models that consistently deliver institutional grade setups:
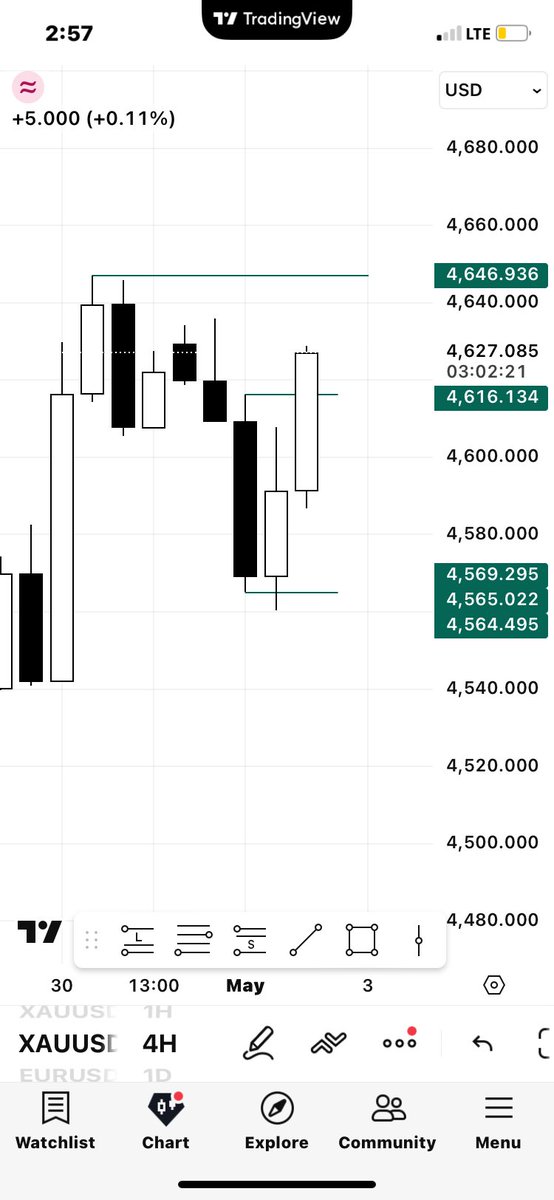
1. 3-Candle CRT
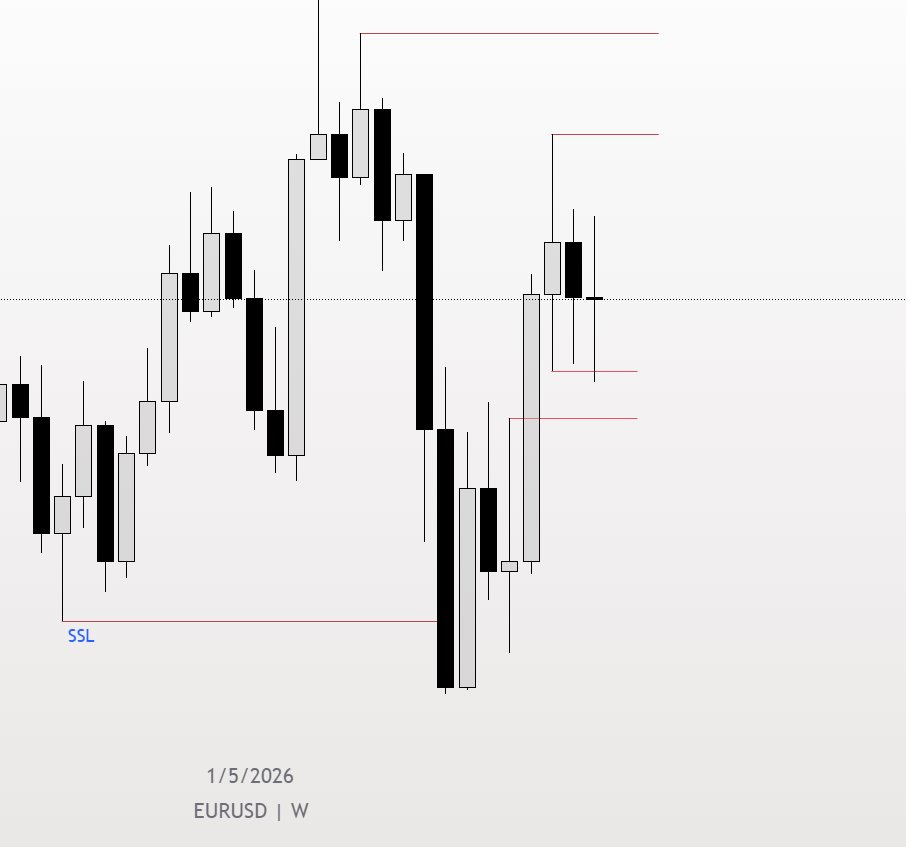
A clean three candle structure that defines a clear CRT Range between the CRT Low and CRT High.
This model is excellent for spotting reversals or strong continuations once price respects the defined range boundaries.
2. CRT+ Inside Bar
The advanced variation that incorporates inside bars within the CRT structure.
This adds extra confluence and precision, often leading to higher probability entries with tighter risk.
Key CRT Confirmations Non Negotiable for High Probability Trades:
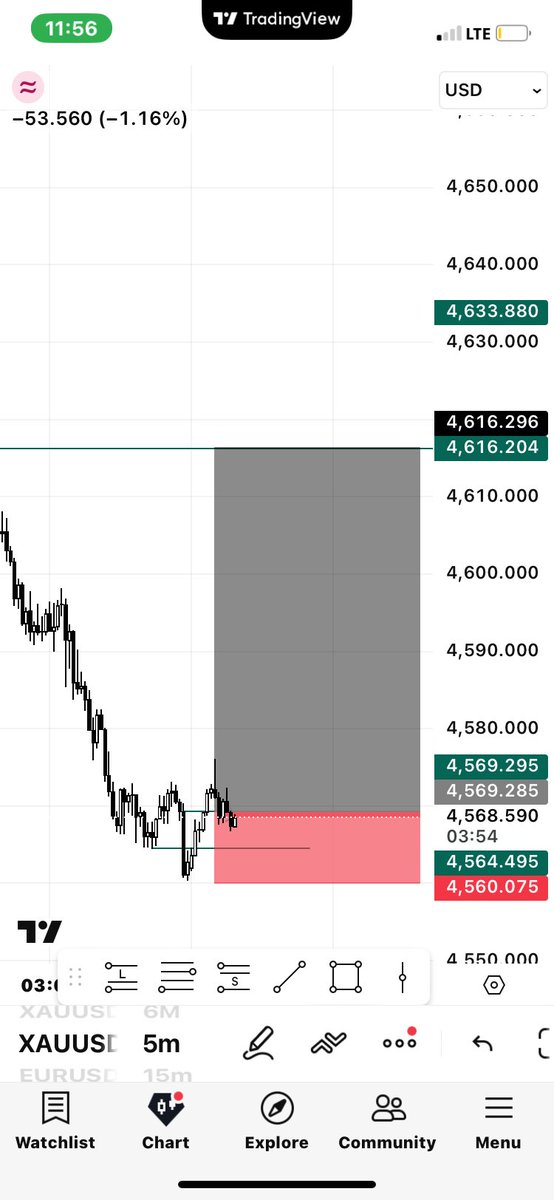
• CRT Range itself
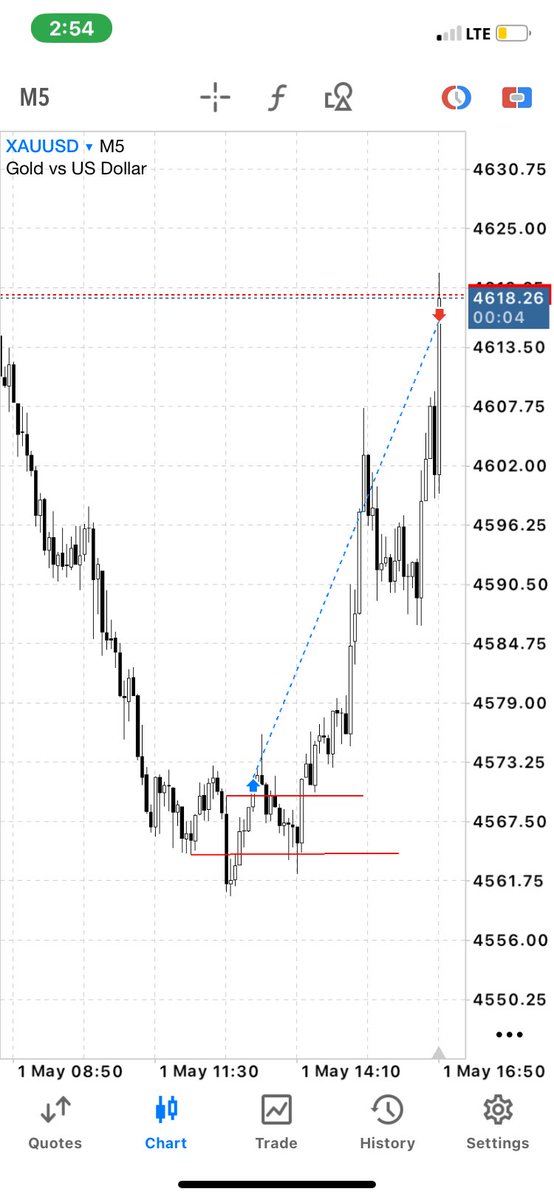
• Turtle Soup pattern (classic liquidity sweep)
• HTF (Higher Timeframe) Key Levels
• LTF (Lower Timeframe) CISD / MSS (Change in State of Delivery / Market Structure Shift)
When these confluences align, CRT setups become some of the highest reward to risk opportunities in forex, indices, gold, and crypto.
Professional traders don’t chase price they wait for CRT + confirmation and let the market come to them.
Drop this chart into your trading journal.
Study it. Backtest it. Apply it.
Which CRT model do you prefer the classic 3 candle or the CRT+ Inside Bar?
And have you ever caught a Turtle Soup inside a CRT range? Share your best setup below 👇
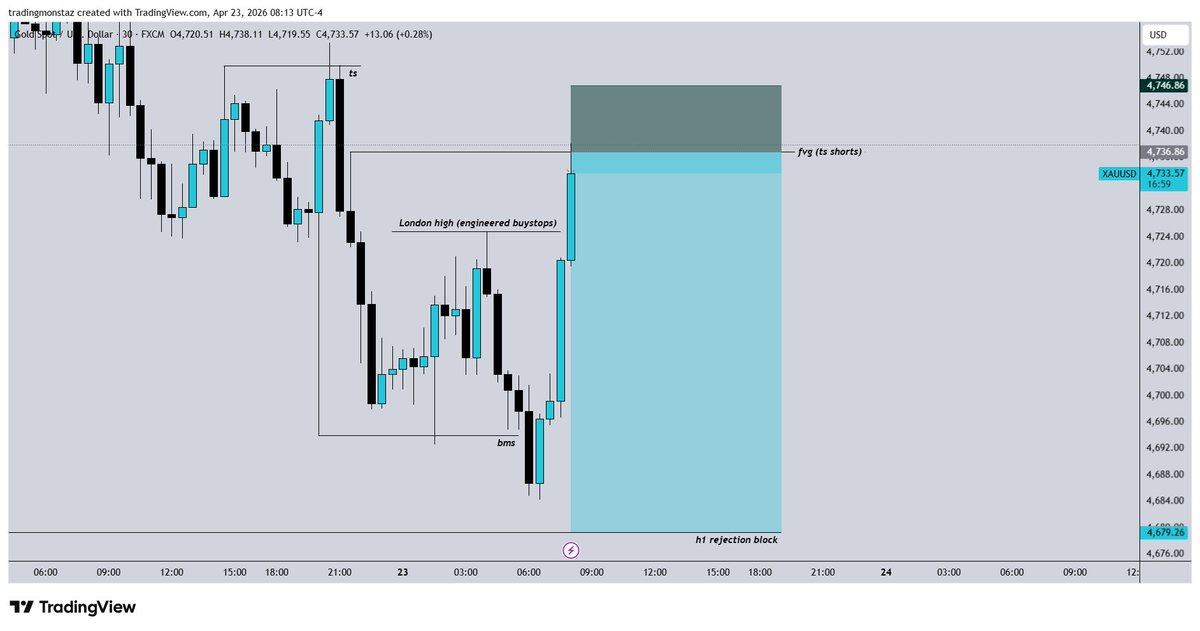
Use ICT to build higher timeframe directional bias.
Use CRT to identify draw on liquidity.
Use ICT to define market context.
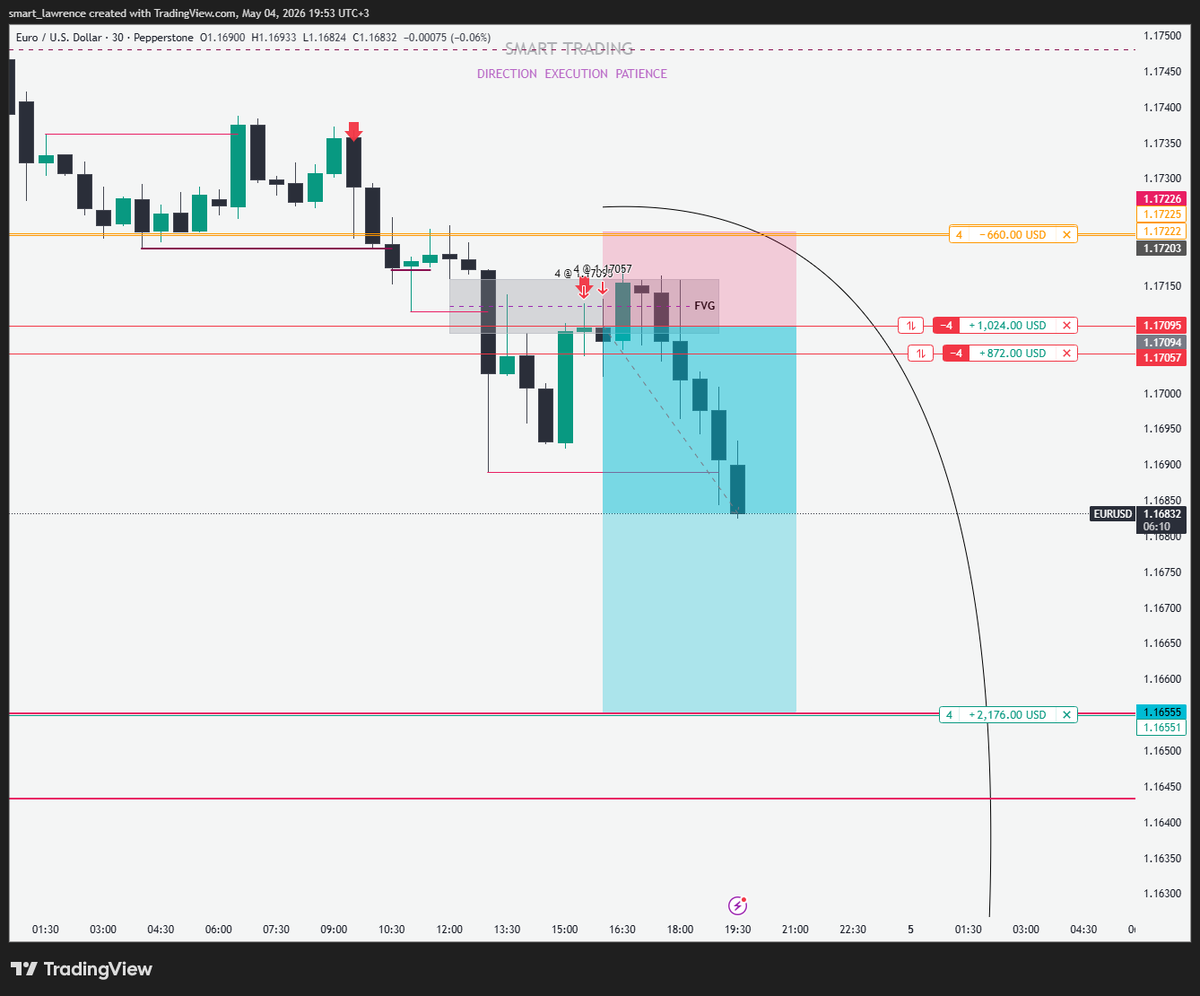
Use CRT to frame entries.
Use ICT to structure your entries.
Use CRT for targets.
At the beginning of each trading week, I genuinely intend on placing ZERO trades.
I never force a trade; trades present themselves to me throughout the week and beg me to take them, I wait.
This is how to trade A+ setups only