Observability is not dashboards.
It’s understanding your system without guessing.
---
A few months ago, we had a production issue.
CPU looked normal.
Memory looked fine.
But users were complaining.
“App is slow.”
---
So we checked dashboards.
Everything looked green.
Still… something was wrong.
---
Then we went deeper.
Checked logs → nothing obvious
Checked metrics → no spikes
Checked traces → and there it was
One API call was taking 3 seconds.
Because of a slow database query.
---
That’s when it clicked.
Monitoring tells you “something is wrong”.
Observability tells you “why it is wrong”.
---
Let’s break it down simply.
---
1️⃣ Metrics (What is happening)
• CPU usage
• Memory
• Request rate
• Error rate
Good for alerts.
But not enough to debug.
---
2️⃣ Logs (What happened)
• Errors
• Events
• Debug info
Useful, but noisy.
You need context to make sense of it.
---
3️⃣ Traces (Where it happened)
This is the game changer.
• Shows request flow
• Tracks latency across services
• Identifies bottlenecks
Without tracing, debugging microservices is guesswork.
Real Observability = Metrics + Logs + Traces
Together.
In production systems:
A request flows like this:
User → API → Service → DB → Cache → External API
If one part slows down,
everything slows down.
Observability helps you see that full path.
Modern tools teams are using:
• Prometheus → metrics
• Grafana → dashboards
• Loki / ELK → logs
• Jaeger / Tempo → tracing
Where AI is changing observability
Now systems can:
• Detect anomalies automatically
• Correlate logs + metrics
• Suggest root cause
• Reduce alert noise
Observability is becoming smarter.
Big mistake I see
People build dashboards,
but don’t design observability.
They track everything,
but understand nothing.
Simple rule
If you can’t answer:
“Why did this request fail?”
in 2 minutes,
you don’t have observability.
Final Thought
Monitoring is watching.
Observability is understanding.
And in production, understanding is everything.
#Observability #DevOps #SRE #Monitoring #Cloudseeding
A few months ago, I thought AI was just about models.
You give a prompt → it gives an answer.
That’s it.
But then I saw something different.
Someone asked an AI:
“What’s the CPU usage in production right now?”
And instead of guessing…
it actually fetched real data and answered.
That’s when I realized:
This is not just a model anymore.
This is a system.
Let me explain what’s really happening.
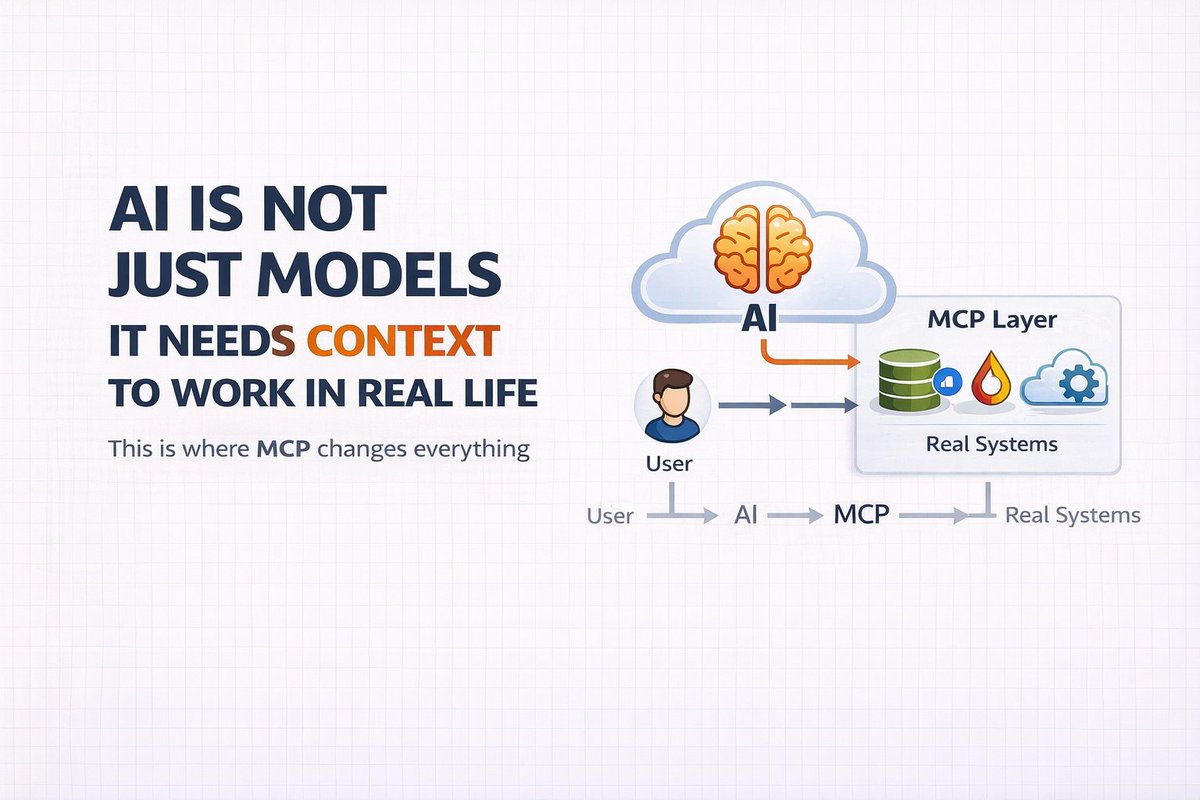
There is something called MCP.
Model Context Protocol.
And this is what makes AI useful in real life.
Earlier, AI had a big limitation.
It could talk well,
but it couldn’t do anything.
It didn’t know:
• what’s happening in your system
• what’s in your database
• what’s your current metrics
Everything was static.
So teams started building integrations.
Custom APIs.
Custom scripts.
Custom logic.
But it became messy very fast.
Every system was different.
Nothing was reusable.
That’s where MCP comes in.
Instead of hardcoding everything,
you give the model access to tools.
Now the model can decide:
“Should I call an API?”
“Should I fetch data?”
“Should I trigger something?”
So the flow becomes like this:
User asks something
→ Model understands
→ Model calls a tool
→ Tool returns real data
→ Model responds
Simple.
But very powerful.
Let’s take a real example.
You ask:
“Why is my application slow?”
A normal AI will guess.
But an MCP-based system will:
• Check logs
• Check metrics
• Look at recent deployments
• Analyze patterns
Then give you a real answer.
This is already being used.
In:
• DevOps automation
• AI agents
• Internal tools
• Customer support systems
And it’s growing very fast.
Companies are not building “chatbots” anymore.
They are building systems that can:
• think
• fetch
• act
If you are in DevOps or Cloud,
this is where things are going.
Soon you won’t just write scripts.
You will build systems where AI:
• monitors systems
• detects issues
• suggests fixes
• even takes actions
Simple way to understand:
LLM = Brain
MCP = Connection to real world
Without MCP,
AI is just talking.
With MCP,
AI actually works.
This is one of those shifts
people will talk about later and say:
“That changed everything.”
Register Here:
Project: MCP + AI Platform on Kubernetes (EKS)
https://t.co/FW5cBiY4Pw
#AI #DevOps #MCP #LLM #CloudGaming
AWS EKS — What Actually Happens When You Deploy an Application
Many people think deploying to Kubernetes means:
kubectl apply -f deployment.yaml
And the app magically runs.
In reality, AWS EKS goes through multiple layers before your application becomes available to users.
Let’s walk through the real flow.
1️⃣ Infrastructure Layer
First, the cluster infrastructure exists inside AWS.
This includes:
• VPC
• Public & Private Subnets
• Security Groups
• Internet Gateway / NAT Gateway
• EKS Control Plane
AWS manages the control plane:
• API Server
• Scheduler
• Controller Manager
• etcd
You only manage worker nodes.
2️⃣ Worker Nodes (Compute Layer)
Applications do not run on the control plane.
They run on worker nodes.
Worker nodes can be:
• EC2 Managed Node Groups
• Self-managed nodes
• AWS Fargate
Each node runs:
• kubelet
• container runtime
• networking plugins
These nodes actually run your Pods.
3️⃣ Deployment Layer
When you run:
kubectl apply -f deployment.yaml
You are sending the desired state to the Kubernetes API server.
Example:
• number of replicas
• container image
• resource limits
• health checks
The scheduler decides which node runs the Pod.
4️⃣ Networking Layer
Inside EKS:
Every Pod gets its own IP.
Communication happens through:
• Services (stable internal access)
• Ingress controllers (external traffic)
Typical production flow:
User → Load Balancer → Ingress → Service → Pod
AWS ALB or NLB usually handles external traffic.
5️⃣ Observability Layer
Production EKS clusters require monitoring.
Most teams integrate:
• Prometheus → metrics collection
• Grafana → dashboards
• CloudWatch → logs and alerts
This helps engineers detect failures early.
6️⃣ Scaling Layer
EKS supports multiple scaling methods:
• Horizontal Pod Autoscaler (scale pods)
• Cluster Autoscaler (scale nodes)
• Karpenter (dynamic node provisioning)
This allows systems to automatically handle traffic spikes.
Key Insight
EKS is not just Kubernetes.
It is Kubernetes integrated deeply with AWS infrastructure.
Understanding these layers helps engineers design reliable production systems.
If you understand:
Infrastructure → Nodes → Pods → Networking → Observability
Then Kubernetes architecture finally starts to make sense.
#AWS #EKS #Kubernetes #DevOps #CloudEngineering
Production Didn’t Break Because of a Bug.
It Broke Because of a Missing Limit.
This happened during a normal deployment window.
Everything looked fine at first:
• Pods were running
• CPU was low
• Memory usage looked normal
• No alerts fired
But suddenly users started reporting slow responses.
Within minutes:
• API latency increased
• Requests started timing out
• Error rates climbed rapidly
The strange part?
Infrastructure metrics were still “green”.
---
What actually happened?
A new service was deployed without resource limits.
That single container started consuming more memory than expected.
Since there were no limits:
• The container kept allocating memory
• Other pods on the node were starved
• Kubernetes began evicting critical services
• API latency exploded
The cluster itself wasn’t broken.
Resource fairness was.
---
How we fixed it
We immediately:
• Added CPU and memory limits to the service
• Restarted the affected nodes
• Balanced pods across the cluster
Within minutes the system stabilized.
---
The lesson
In Kubernetes, missing limits are dangerous.
Without them:
• One container can starve others
• Nodes become unstable
• Latency spikes unexpectedly
• Incidents become harder to diagnose
---
Simple rules we now follow:
Always define:
• CPU requests
• CPU limits
• Memory requests
• Memory limits
Kubernetes is powerful,
but it assumes engineers define safe boundaries.
Production rarely breaks because of Kubernetes.
It breaks because of configuration choices.
#DevOps #Kubernetes #ProductionEngineering #SRE #CloudEngineering
CI/CD Is Not About Speed. It’s About Confidence.
Many teams think CI/CD means:
“Deploy faster.”
That’s only half the story.
Real CI/CD is about deploying with confidence.
Here’s what most teams misunderstand.
1️⃣ CI Is More Than Running Tests
Continuous Integration should verify:
• Code compiles
• Unit tests pass
• Dependencies are secure
• Linting and standards are enforced
• Infrastructure changes are validated
If CI only checks “build success”,
it’s weak protection.
2️⃣ CD Is Risk Management
Continuous Delivery is not auto-deploying everything.
It should include:
• Environment-based approvals
• Canary or blue-green rollout
• Health checks before traffic switch
• Rollback automation
• Monitoring after release
Deployment is a controlled event,
not a blind push.
3️⃣ Pipelines Should Fail Loudly
If your pipeline:
• Hides warnings
• Ignores security findings
• Skips flaky tests
• Allows force-merges
You don’t have CI/CD.
You have automated risk.
4️⃣ Infrastructure Must Be in the Pipeline
Modern CI/CD should handle:
• Terraform validation
• Docker image scanning
• Kubernetes manifest checks
• Policy enforcement
Application code and infrastructure must evolve together.
5️⃣ Feedback Speed Matters More Than Deployment Speed
The fastest teams are not those who deploy most.
They are those who get feedback fastest.
Short feedback loops:
• Reduce bugs
• Reduce fear
• Reduce rollback stress
• Increase developer productivity
Final Truth
CI/CD is not a DevOps checkbox.
It is a reliability mechanism.
A strong pipeline makes releases boring.
A weak pipeline makes every deployment stressful.
If deployments still create anxiety,
your CI/CD design needs improvement.
#CICD #DevOps #Jenkins #Automation #ProductionEngineering
Most DevOps Issues Are Not Tool Problems — They’re Design Problems
When something breaks in production,
the first reaction is often:
“Pipeline failed.”
“Kubernetes issue.”
“Cloud problem.”
But most DevOps issues are not tool failures.
They are design mistakes.
Here are common DevOps issues I keep seeing.
1️⃣ Over-Automation Without Guardrails
Automation is powerful.
But unsafe automation is dangerous.
Common mistake:
• Auto-deploying directly to production
• No approval gates
• No staged rollout
• No rollback validation
Automation should reduce risk.
Not amplify it.
2️⃣ Poor Environment Parity
“Works in staging” means nothing
if staging doesn’t match production.
Differences in:
• Database size
• Traffic load
• Networking rules
• Resource limits
Cause surprises during release.
3️⃣ No Observability Strategy
Teams deploy fast.
But can’t answer:
• Why did latency increase?
• Which service failed first?
• What changed recently?
Monitoring dashboards are not observability.
Without traces and structured logs,
debugging becomes guesswork.
4️⃣ IAM and Permission Chaos
Over-permissioned roles are common.
When:
• Every service has admin access
• No least privilege model
• Secrets are loosely managed
Security incidents become likely.
5️⃣ Ignoring Resource Limits
Containers without limits.
Databases without connection caps.
Retries without backoff.
These are small config choices.
But they create cascading failures.
6️⃣ No Ownership Model
When something breaks,
everyone looks at everyone else.
DevOps works only when:
• Services have clear owners
• Alerts have clear responders
• Runbooks exist
• Responsibility is defined
Final Truth
DevOps is not about using the latest tools.
It’s about building systems that behave predictably under stress.
Most issues are not sudden.
They are accumulated shortcuts.
The strongest DevOps teams focus on:
• Discipline
• Design clarity
• Safe automation
• Continuous improvement
Tools change.
Principles don’t.
#DevOps #ProductionEngineering #SRE #CloudEngineering #CICD
Blue-Green Deployment in Jenkins — Zero Downtime Without Fear
One of the safest ways to deploy to production is Blue-Green deployment.
If you use Jenkins for CI/CD, this strategy becomes very powerful.
Here’s what it means.
Blue-Green deployment uses two identical production environments:
• Blue → Current live version
• Green → New version
At any time, only one environment serves real users.
How It Works with Jenkins
1️⃣ Jenkins builds the new version
• Code is pushed
• Pipeline runs tests
• Docker image is built
• Artifacts are stored
2️⃣ Deploy to the inactive environment
If Blue is live,
Jenkins deploys the new version to Green.
Green is fully deployed but not receiving traffic yet.
3️⃣ Validation phase
Before switching traffic:
• Health checks run
• Smoke tests execute
• Logs and metrics are verified
• Database migrations are checked
4️⃣ Traffic switch
Load balancer updates target from Blue → Green.
This switch is usually:
• Instant
• Low risk
• Reversible
5️⃣ Rollback if needed
If something fails:
Switch traffic back to Blue immediately.
No redeployment required.
Just a traffic flip.
Why Blue-Green Is Powerful
• Zero downtime
• Instant rollback
• Safe production testing
• Reduced deployment anxiety
Common Jenkins Setup
Jenkins pipeline stages often include:
Build → Test → Deploy-Green → Verify → Switch-Traffic → Monitor
The traffic switch can be automated via:
• AWS ELB / ALB
• NGINX
• Kubernetes service update
• Cloud load balancer APIs
What Teams Often Miss
Blue-Green does not automatically solve:
• Database backward compatibility
• Shared state issues
• Long-running sessions
• Cache synchronization
You must design for compatibility.
Final Thought
Blue-Green deployment is not just a CI/CD trick.
It’s a risk management strategy.
Jenkins enables automation.
But the real value comes from careful system design.
Safe deployments build confident teams.
#DevOps #Jenkins #CICD #BlueGreenDeployment #ProductionEngineering
AWS AI Agents — What They Are and Why DevOps Engineers Should Care
AI agents are no longer sci-fi.
They are becoming foundational components in cloud automation and operations.
AWS AI Agents are not just “AI models” you call from code.
They are **autonomous agents** that observe, decide, and act on cloud environments.
Here’s what that means in practice.
1️⃣ Not Scripts, but Intent-Driven Automation
Traditional automation runs what you tell it to run.
AI agents reason about intent.
Instead of:
“Run this script every time…”
You tell an agent:
“Ensure production security posture never drifts.”
The agent then:
• Monitors resources
• Detects changes
• Plans corrective actions
• Triggers safe automation
This is a shift from *commands* to *intent*.
2️⃣ Continuous Observation + Action Loop
AWS AI Agents continuously collect signals from:
• CloudTrail
• Config
• CloudWatch
• GuardDuty
• Service APIs
They analyze behavior, not just events.
They spot anomalies before alerts fire.
3️⃣ Decision Making, Not Just Recommendations
Existing AI tools help you *suggest fixes*.
AI agents can *execute them* under guardrails.
For example:
• Restore deleted security group rules
• Scale services before containers churn
• Revoke risky IAM roles automatically
• Fix drift between Terraform and live state
But always with human oversight and approvals where required.
4️⃣ Integration With DevOps and GitOps Workflows
Agents can:
• Create Pull Requests with fixes
• Annotate code with context
• Automate policy enforcement
• Provide remediation plans with evidence
• Trigger rollbacks based on risk signals
This bridges the gap between insights and actions.
5️⃣ AWS Native + Partner Ecosystem
With AWS building agent frameworks and services,
DevOps teams can leverage:
• Vector databases for context
• Model evaluations across logs/metrics
• Feedback loops into pipelines
• Self-healing infrastructure logic
This is not tool hype.
This is automation evolution.
Final Truth
AI agents don’t replace DevOps engineers.
They augment decision quality and automation velocity.
The engineers who succeed with AWS AI Agents will be those who:
• Understand failure domains
• Define safe intent boundaries
• Build guardrails into automation
• Blend human judgment with autonomous action
AI agents will handle automation.
Engineers will still own outcomes.
#AWS #AIAgents #DevOps #Automation #CloudEngineering
DevSecOps in 2026 — Security Is No Longer a Separate Team
There was a time when security happened at the end.
Develop → Deploy → Then security review.
That model doesn’t survive modern release speed.
DevSecOps changes one fundamental idea:
Security is integrated, not attached.
Here’s what DevSecOps actually means in real systems.
1️⃣ Security in CI/CD
Every pipeline should include:
• SAST (static code analysis)
• Dependency scanning
• Container image scanning
• Secret detection
• Policy validation
If a build fails security checks,
it does not ship.
Security becomes part of “definition of done.”
2️⃣ Infrastructure as Code + Policy as Code
Terraform, CloudFormation, Kubernetes YAML —
all must be validated before deployment.
Using tools like:
• OPA (Open Policy Agent)
• Sentinel
• Checkov
• Trivy
This prevents:
• Public S3 buckets
• Open security groups
• Over-permissioned IAM roles
Security shifts left — into code reviews.
3️⃣ Runtime Security
DevSecOps doesn’t stop at deployment.
You need:
• Container runtime monitoring
• Kubernetes policy enforcement
• IAM anomaly detection
• Log-based threat detection
Prevention + detection = real security posture.
4️⃣ Least Privilege Everywhere
DevSecOps teams enforce:
• Minimal IAM roles
• Short-lived credentials
• Secrets rotation
• Service-to-service authentication
Reducing blast radius is the real goal.
5️⃣ Culture Over Tools
DevSecOps fails when security is seen as “blocking.”
It works when:
• Developers understand risk
• Security teams enable, not restrict
• Automation replaces manual audits
• Guardrails replace approvals
Security becomes a shared responsibility.
Final truth:
DevSecOps is not adding more scanners.
It’s redesigning workflows so that insecure code never reaches production.
The strongest DevOps teams in 2026
are the ones where security is invisible —
because it is built in.
#DevSecOps #DevOps #CloudSecurity #CyberSecurity #PlatformEngineering
What an SRE Really Does (Beyond On-Call)
Many people think SRE = the person who gets paged at night.
That’s only the visible part.
The real SRE role is about engineering reliability into the system.
Here’s what SRE actually means in modern teams.
1️⃣ Reliability as a Measurable Goal
SREs don’t say “keep it stable.”
They define:
• SLIs (Service Level Indicators)
• SLOs (Service Level Objectives)
• Error budgets
Reliability becomes measurable, not emotional.
2️⃣ Reducing Toil
If something is repeated manually,
an SRE automates it.
Toil includes:
• Repetitive deployments
• Manual failovers
• Log scraping
• Restarting services
SREs build systems that don’t require heroics.
3️⃣ Designing for Failure
SREs assume systems will fail.
They implement:
• Timeouts
• Retries with limits
• Circuit breakers
• Graceful degradation
• Capacity planning
Failure becomes predictable, not chaotic.
4️⃣ Improving Incident Response
During incidents, SREs focus on:
• Stabilizing first
• Communicating clearly
• Avoiding blame
• Documenting timelines
• Fixing root cause later
They optimize for recovery speed.
5️⃣ Balancing Speed and Safety
Product teams want faster releases.
Leadership wants reliability.
SREs manage this tension using:
• Error budgets
• Deployment guardrails
• Observability
• Risk-based decision making
The real value of SRE:
They turn reliability into engineering discipline.
Not luck.
Not hero culture.
Not endless firefighting.
In 2026, strong SREs are expected to:
• Understand systems deeply
• Think in failure patterns
• Automate safely
• Design scalable reliability
SRE is not operations.
It’s reliability engineering.
#SRE #ReliabilityEngineering #DevOps #PlatformEngineering #CloudEngineering
Observability in DevOps — Why Monitoring Is Not Enough
Many teams say:
“We have monitoring.”
But when production slows down,
they still don’t know why.
That’s the difference between monitoring and observability.
Monitoring tells you something is wrong.
Observability tells you why.
In real production environments, observability means three things.
1️⃣ Metrics — What is happening?
You track:
• Latency
• Error rate
• Traffic
• Saturation (CPU, memory, connections)
Metrics show symptoms.
They rarely show root cause.
2️⃣ Logs — What exactly failed?
Logs give context:
• Which request failed?
• Which dependency timed out?
• What changed recently?
• What exception was thrown?
Without structured logs,
debugging becomes guessing.
3️⃣ Traces — Where did the request go?
In microservices,
one request touches multiple services.
Tracing shows:
User → API → Service A → Service B → Database → Cache
When latency spikes,
traces reveal the slow hop.
Without tracing,
you’re blind in distributed systems.
Here’s the mistake most teams make:
They collect data.
But they don’t design observability.
Good observability is intentional:
• Clear SLIs and SLOs
• Alerts tied to user impact
• Correlated metrics + logs + traces
• Defined ownership for every alert
• Dashboards built for decision-making
Another truth:
Observability reduces panic.
When dashboards are clear,
incidents feel structured.
When observability is weak,
incidents feel chaotic.
Final thought:
DevOps is not just about deploying systems.
It’s about understanding how they behave under stress.
Observability is what turns unknown failures
into predictable engineering problems.
And predictable systems are stable systems.
#Observability #DevOps #SRE #Monitoring #ProductionEngineering
Yesterday’s Production Issue Reminded Me of One Simple Truth
Production rarely fails loudly at first.
It started small.
A slight increase in latency.
Nothing alarming.
No major alerts.
Just a subtle shift in response time.
Within 20 minutes:
• Error rate started creeping up
• CPU usage increased on one service
• Database connections began saturating
At first glance, everything looked “mostly fine.”
But something felt off.
We checked recent deployments.
Nothing major.
Just a small configuration change.
That small change?
It reduced a timeout threshold.
What happened next:
• Requests retried more aggressively
• Retry traffic increased load
• Database connection pool filled up
• Latency increased further
• More retries triggered
A feedback loop.
The system wasn’t broken.
It was stressed.
We fixed it by:
• Rolling back the config
• Reducing retry aggressiveness
• Monitoring connection pool recovery
• Watching latency stabilize
The system calmed down within minutes.
What this incident reinforced:
1️⃣ Small changes can have large ripple effects
2️⃣ Retries are dangerous without limits
3️⃣ Databases are often the real bottleneck
4️⃣ Early signals matter more than alerts
Production doesn’t fail randomly.
It fails when small assumptions compound.
Yesterday wasn’t dramatic.
But it was educational.
And those are the incidents that make you sharper.
#ProductionEngineering #DevOps #SRE #CloudEngineering #IncidentManagement
Terraform Basics Most Engineers Overlook (Until Production Breaks)
Terraform looks simple:
Write code → terraform apply → infrastructure appears.
But real Terraform basics are not about syntax.
They are about safety.
Here are the fundamentals that truly matter.
1️⃣ Terraform Is State-Driven
Terraform does not “run scripts.”
It compares desired state vs current state.
If state is wrong:
Terraform decisions will be wrong.
That’s why:
• Remote state is critical
• State locking is mandatory
• Manual infra changes are dangerous
State discipline = production safety.
2️⃣ Plan Is a Risk Review
terraform plan is not a formality.
It is your change approval preview.
It shows:
• What will be created
• What will be modified
• What will be destroyed
If you don’t review plans carefully,
you’re gambling with infrastructure.
3️⃣ Dependencies Are Not Always Obvious
Terraform builds a dependency graph.
Implicit dependencies work most of the time.
But sometimes you must use:
depends_on
Misunderstood dependencies cause:
• Partial applies
• Broken rollouts
• Hidden failures
4️⃣ Variables Define Architecture Flexibility
Hardcoded values create fragile infrastructure.
Good variable design allows:
• Multi-environment deployments
• Reusability
• Cleaner CI/CD integration
Bad variable design creates chaos.
5️⃣ Modules Are About Standardization
Modules are not just for reuse.
They enforce consistency.
Strong Terraform teams:
• Create golden modules
• Lock down patterns
• Avoid copy-paste infra
Consistency reduces outages.
6️⃣ Terraform Does Not Replace Architecture Thinking
Terraform can provision:
• VPCs
• Databases
• Clusters
• Load balancers
But it cannot decide:
• Correct subnet design
• Secure IAM policies
• Right scaling strategy
Terraform automates decisions.
It does not make them.
Final truth:
Terraform basics are not beginner knowledge.
They are production guardrails.
If you master state, planning, dependencies, and modular design —
you’re already ahead of most engineers.
#Terraform #InfrastructureAsCode #DevOps #CloudEngineering #AWS
Security in 2026 — Why Most Breaches Are Not “Hacks”
When a security incident happens,
people imagine sophisticated attacks.
In reality, most breaches are caused by:
• Misconfigured IAM
• Public storage buckets
• Exposed credentials
• Over-permissioned roles
• Unpatched dependencies
• Weak network boundaries
Security failures are usually operational failures.
Here’s what modern cloud security actually means.
1️⃣ IAM Discipline
The biggest risk in cloud is identity.
Questions every team should answer:
• Who can assume this role?
• What is the least privilege needed?
• What happens if these keys leak?
• Are permissions reviewed regularly?
Over-permissioned IAM is the silent threat.
2️⃣ Network Boundaries
Security Groups, NACLs, private subnets —
these are not checkboxes.
If everything talks to everything,
you don’t have a secure system.
Segmentation reduces blast radius.
3️⃣ Secrets Management
Hardcoding credentials is still common.
Production-grade systems use:
• Secrets Manager
• KMS
• Vault
• Short-lived tokens
Secrets should rotate.
Access should be auditable.
4️⃣ Observability for Security
Security is not only prevention.
It’s detection.
You need:
• CloudTrail logging
• IAM activity tracking
• Anomaly detection
• Alerts on unusual patterns
If you can’t detect misuse,
you don’t have security.
5️⃣ Infrastructure as Code
Manual changes create drift.
Drift creates blind spots.
Security improves when:
• Infra is version-controlled
• Changes are reviewed
• Policies are automated
Security must be part of CI/CD,
not a post-deployment checklist.
Final truth:
Security is not a tool.
It’s a design principle.
If your system depends on “nobody will try that,”
it’s already vulnerable.
Strong security comes from:
• Least privilege
• Clear boundaries
• Continuous monitoring
• Automated guardrails
That’s modern cloud security.
#CloudSecurity #DevOps #CyberSecurity #AWS #PlatformEngineering
AWS Services in 2026 — Stop Learning Them as a List
Many engineers try to “learn AWS” by memorizing services.
EC2.
S3.
RDS.
Lambda.
EKS.
CloudFront.
IAM.
But AWS is not a list.
It’s a system.
If you don’t understand how services connect,
you don’t understand AWS.
Here’s how to think about AWS properly.
1️⃣ Compute Layer
Where your code runs:
• EC2
• Lambda
• ECS
• EKS
• Fargate
The real question:
How does your workload scale?
Stateless or stateful?
Short-lived or long-running?
2️⃣ Storage Layer
Where your data lives:
• S3 (object)
• EBS (block)
• EFS (file)
• RDS / Aurora (relational)
• DynamoDB (NoSQL)
The real question:
What are your read/write patterns?
Latency requirements?
Durability needs?
3️⃣ Networking Layer
How traffic flows:
• VPC
• Subnets
• Route Tables
• Security Groups
• Load Balancers
• CloudFront
The real question:
What happens if traffic doubles?
What happens if an AZ fails?
4️⃣ Identity & Security
Who can do what:
• IAM
• KMS
• Secrets Manager
• Cognito
• WAF
The real question:
What is your blast radius if credentials leak?
5️⃣ Observability & Operations
How you see and control:
• CloudWatch
• CloudTrail
• X-Ray
• Config
• Systems Manager
The real question:
How fast can you detect and fix failures?
Most AWS problems are not service problems.
They are architecture problems.
Engineers who grow fast in AWS
don’t try to learn 200 services.
They master:
• Core compute
• Core networking
• Core storage
• IAM deeply
• Monitoring seriously
Everything else builds on that.
Final truth:
AWS is not about knowing every service.
It’s about designing safe, scalable systems using the right ones.
That’s what companies hire for.
#AWS #CloudEngineering #DevOps #CloudArchitecture #SRE
The DevOps Trend Nobody Talks About in 2026
It’s not Kubernetes.
It’s not AI.
It’s not multi-cloud.
It’s Platform Engineering.
Companies are quietly moving away from “everyone does DevOps”
to structured internal platforms.
Here’s what’s changing.
Instead of every team managing:
• Their own CI/CD
• Their own Terraform
• Their own Kubernetes configs
• Their own monitoring
Organizations are building Internal Developer Platforms (IDPs).
Why?
Because DevOps doesn’t scale when:
• Every team reinvents pipelines
• YAML files grow uncontrollably
• Infrastructure standards drift
• Security reviews become bottlenecks
Platform teams now provide:
• Golden Terraform modules
• Standardized CI/CD templates
• Secure Kubernetes baselines
• Self-service infrastructure
• Built-in observability
Developers focus on shipping features.
Platform engineers focus on reliability and guardrails.
This is the shift.
DevOps is not disappearing.
It’s maturing.
The new reality in 2026:
• Fewer “general DevOps” roles
• More Platform Engineers
• More SRE roles
• More automation ownership
• More AI-assisted workflows
The engineers who thrive are those who:
• Understand systems deeply
• Think in architecture
• Build reusable foundations
• Reduce cognitive load for others
Tools are expected.
System thinking is rare.
That’s the real trend.
#DevOps #PlatformEngineering #SRE #CloudEngineering #Kubernetes
What Changed with the Kubernetes Gateway API — And Why It Matters in Production
For a long time, Kubernetes traffic management revolved around Ingress.
It worked — but it didn’t scale well for real production systems.
Gateway API is not just a new resource.
It is a redesign of how Kubernetes handles north-south traffic.
Here’s what actually changed.
Ingress tried to do everything with one object.
Routing rules, TLS, load balancer behavior, extensions — all mixed together.
This created problems:
• Heavy reliance on vendor annotations
• Poor support for advanced routing
• No clear ownership between teams
• Difficult multi-tenant setups
Gateway API fixes this by separating responsibilities.
Traffic management is now split into clear layers.
GatewayClass
Owned by platform teams
Defines the underlying implementation (NGINX, Envoy, cloud load balancers)
Gateway
Owned by infra/platform teams
Defines where traffic enters the cluster — ports, protocols, TLS
Routes (HTTPRoute, TCPRoute, etc.)
Owned by application teams
Defines how traffic is routed to services
This separation matches how real organizations operate.
Another major change is first-class support for modern traffic patterns.
Gateway API natively supports:
• HTTP, HTTPS, TCP, UDP
• gRPC traffic
• Header-based routing
• Traffic splitting (canary, blue/green)
• TLS and mTLS
All without controller-specific annotations.
Security and multi-tenancy are also improved.
Platform teams can control:
• Which routes can attach to a gateway
• Who can expose traffic
• How entry points are secured
Application teams focus only on routing logic.
This reduces risk and accidental exposure.
The bigger picture.
Ingress solved “how do we expose a service?”
Gateway API solves “how do we manage traffic at scale?”
Ingress is now considered legacy.
Gateway API is the long-term direction of Kubernetes networking.
If you work with:
• Kubernetes in production
• Multi-team clusters
• Platform engineering
• Advanced deployment strategies
Gateway API is something you should start learning now.
It’s not a feature upgrade.
It’s an architectural upgrade.
#Kubernetes #GatewayAPI #DevOps #PlatformEngineering #CloudNative