South Dakota Born and Raised. Anesthesia via Mayo Clinic RST. CV Anesthesia via Vanderbilt 2027. Anything Anesthesia/CC/CVA Related. Outdoors-Berner/Cat Dad
Video of the month
🚨 Neonatal LV Inflow Obstruction
In this rare TAPVD case, a deceptive membrane hinted at cor triatriatum sinister, but intraoperative TEE revealed septum primum malposition instead.
🔍🫀
https://t.co/7D0WOggnaW
#PediatricCardiacAnesthesia
🫀NEW GUIDELINE🫀
Read our newest #ASEGuideline, "Recommendations for the Evaluation of Left Ventricular Diastolic Function by Echocardiography and for Heart Failure With Preserved Ejection Fraction Diagnosis!" https://t.co/bKTTQachMJ
Transthoracic Echocardiographic (TTE) Views: A Complete Guide
Understanding TTE views is essential for accurate cardiac imaging. Let’s break down the 5 core views:
1️⃣ Parasternal Long Axis
2️⃣ Parasternal Short Axis
3️⃣ Apical
4️⃣ Subxiphoid
5️⃣ Suprasternal
A thread 🧵
New review : the evolving role of VA-ECMO for high-risk PE:
⚠️ 65% mortality in untreated cases
⏱️ Early ECMO initiation (pre-arrest) linked to better survival
💥 Synergy with thrombolytics/thrombectomy
🛠️ Bridging to recovery or definitive therapy
https://t.co/UqOKw4H7hR
ECG PEARL: Wide Complex Tachycardia. V or SVT with Aberrancy?
Distinguishing VT from SVT with aberrancy is critical in acute care. This classic diagnostic flowchart guides you through key ECG features step by step.
Start here:
🟦 AV dissociation? → Think VT
Look for independent P waves, fusion beats (f), and capture beats (C) ✊ hallmarks of ventricular origin.
🟦 Precordial Concordance?
If V1–V6 show all positive or all negative complexes → Likely VT
🟦 Lead aVR clues:
Any of the following favors VT:
▶️ Monophasic R wave
▶️ Initial q or R > 40 ms
▶️ Notched Q or S wave
🟦 V1 pattern:
- Dominant R, Rr’, or slurred S > 40 ms → VT
- Typical RBBB or LBBB with rS pattern → Suggests SVT with aberrancy
When the diagnosis is uncertain in a wide complex tachycardia, assume VT and treat accordingly especially in older patients or those with structural heart disease.
Image Source:
Kindwall KE et al., Am J Cardiol 1988
Wellens HJ et al., Am J Med 1978
Brugada P et al., Circulation 1991
Vereckei A et al., Heart Rhythm 2008
#Cardiology #ECG #VT #SVT #MedTwitter #EmergencyMedicine #EP
Quantifying Mitral Stenosis: The PISA Method
In mitral stenosis (MS), blood accelerates toward the narrowed mitral orifice, forming hemispheric shells of equal velocity, PISA zones, visible as color aliasing on Doppler.
Concept of PISA:
By applying the continuity principle (Flow = Area × Velocity), we can estimate Mitral Valve Area (MVA) using the PISA method.
Key Steps:
1️⃣ Image in A4C view
Identify flow convergence (PISA shell) just proximal to the mitral leaflets.
2️⃣ Adjust the Nyquist limit
Shift the baseline upward to optimize aliasing visibility, usually around 40 cm/sec.
3️⃣ Measure the PISA radius (r)
From the first aliasing contour to the orifice.
4️⃣ Use CW Doppler to obtain Vmax (E wave)
Peak velocity of mitral inflow through the stenotic valve.
5️⃣ Apply the continuity equation:
MVA = [2 × π × r² × Valias × (α / 180)] / Vmax
Where:
- r = PISA radius (cm)
- Valias = aliasing velocity (cm/s)
- Vmax = peak mitral inflow velocity (cm/s)
- α = convergence angle in degrees
PISA-based MVA is especially helpful when planimetry is suboptimal or calcification distorts direct measurement.
Reference:
Zoghbi WA et al. Recommendations for Noninvasive Evaluation of Native Valvular Regurgitation. JASE, 2009.
ASE Guidelines 2021.
Understanding Diastolic Dysfunction with Doppler Echocardiography
This chart beautifully compares Doppler findings in normal vs. varying grades of LV diastolic dysfunction from inflow (E/A, DT) to tissue Doppler (E′/A′), pulmonary vein flow, LA volume, and TR velocity.
Source: Catherine M. Otto, Textbook of Clinical Echocardiography
#Cardiology #Echocardiography #HeartFailure #MedEd
We are sad to announce that Dr. Ronald D. Miller has passed away. He served as our chair from 1984 until 2008, and was one of the most successful physician-scientist-leaders in the field’s history. Read more about his remarkable life and legacy: https://t.co/M2Y8yDdTSK
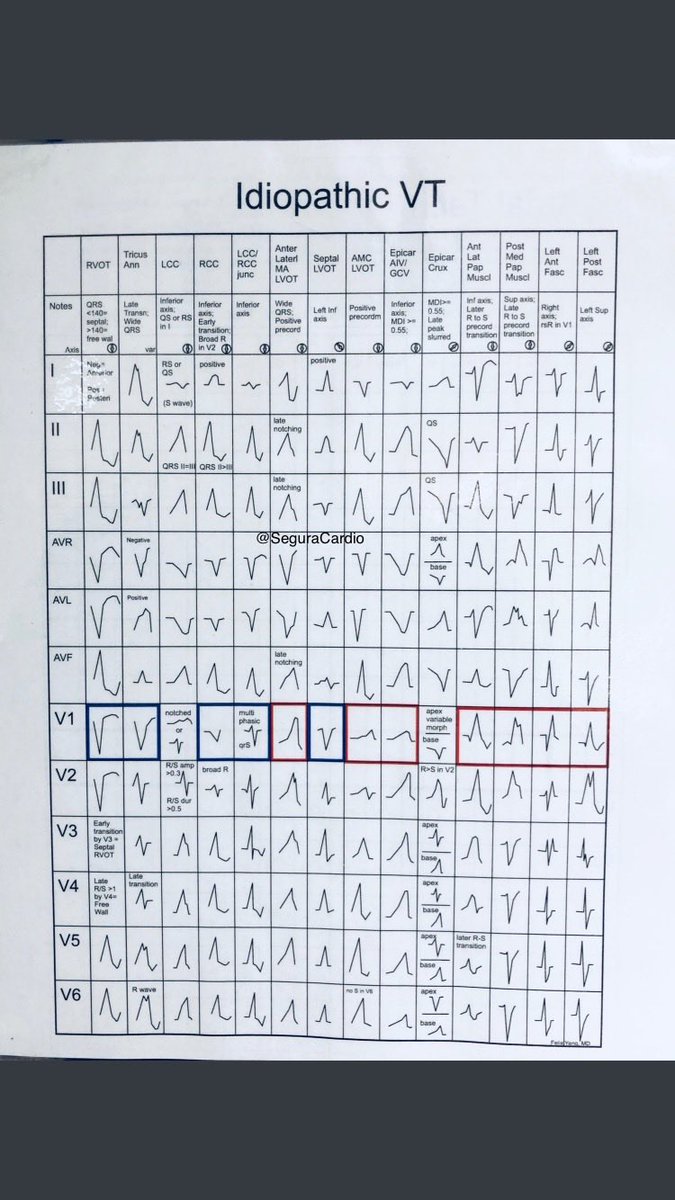
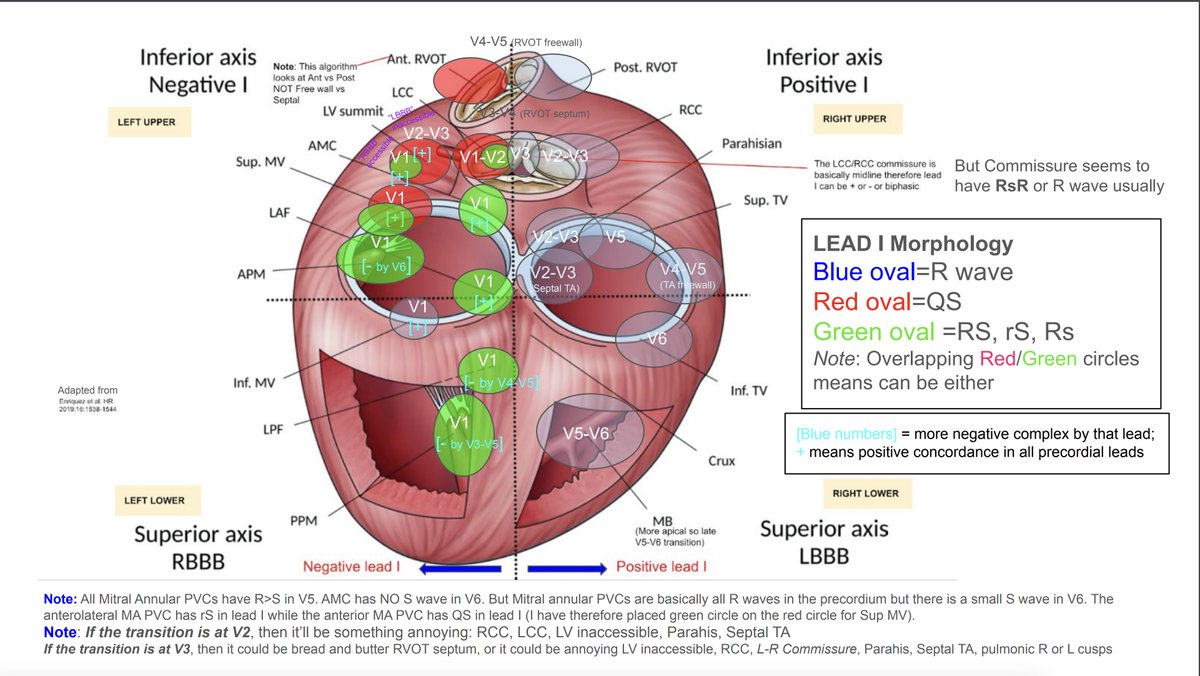
PVC localization diagram. Added my own touches. adapted from the nice figure by Enriquez et al. Illustrates the precordial transitions to positive complexes, lead I morphology (blue/red/green circles), and precordial transition to negative complexes. #EPeeps





![TrackYourHeart's tweet photo. Quantifying Mitral Stenosis: The PISA Method
In mitral stenosis (MS), blood accelerates toward the narrowed mitral orifice, forming hemispheric shells of equal velocity, PISA zones, visible as color aliasing on Doppler.
Concept of PISA:
By applying the continuity principle (Flow = Area × Velocity), we can estimate Mitral Valve Area (MVA) using the PISA method.
Key Steps:
1️⃣ Image in A4C view
Identify flow convergence (PISA shell) just proximal to the mitral leaflets.
2️⃣ Adjust the Nyquist limit
Shift the baseline upward to optimize aliasing visibility, usually around 40 cm/sec.
3️⃣ Measure the PISA radius (r)
From the first aliasing contour to the orifice.
4️⃣ Use CW Doppler to obtain Vmax (E wave)
Peak velocity of mitral inflow through the stenotic valve.
5️⃣ Apply the continuity equation:
MVA = [2 × π × r² × Valias × (α / 180)] / Vmax
Where:
- r = PISA radius (cm)
- Valias = aliasing velocity (cm/s)
- Vmax = peak mitral inflow velocity (cm/s)
- α = convergence angle in degrees
PISA-based MVA is especially helpful when planimetry is suboptimal or calcification distorts direct measurement.
Reference:
Zoghbi WA et al. Recommendations for Noninvasive Evaluation of Native Valvular Regurgitation. JASE, 2009.
ASE Guidelines 2021.](https://pbs.twimg.com/media/GqM4oOWW4AAoyCf.jpg)