A useful alert provides a defined reference point before expansion begins.
WoodsBot Trade Alerts marked the the-open-network:native short entry, giving traders a clear level from which to manage the developing move.
Monday sets the levels. The rest of the week reveals the reaction.
Our indicator maps both boundaries automatically, keeping weekly structure, breakout zones, and potential reversal areas in view.
Access should be straightforward.
Choose a WoodsBot partner link, complete the exchange setup, trade actively, and submit your UID for verification.
That is the path to WoodsBot full access. Link is in the BIO.
Our trade alert bot had ethereum:native entry locked at 1769 through the base. From there it ran to a peak above 1940, the kind of move that makes the wait worth it
Two states, that’s the whole concept. Risk on, capital moves from stables into BTC and alts. Risk off, it moves back. Knowing which one the market is in tells you more than most single charts do.
Demand zones form in three steps. Impulse, pullback, continuation. The zone is where buyers stepped in the first time, not wherever the bounce happens to land.
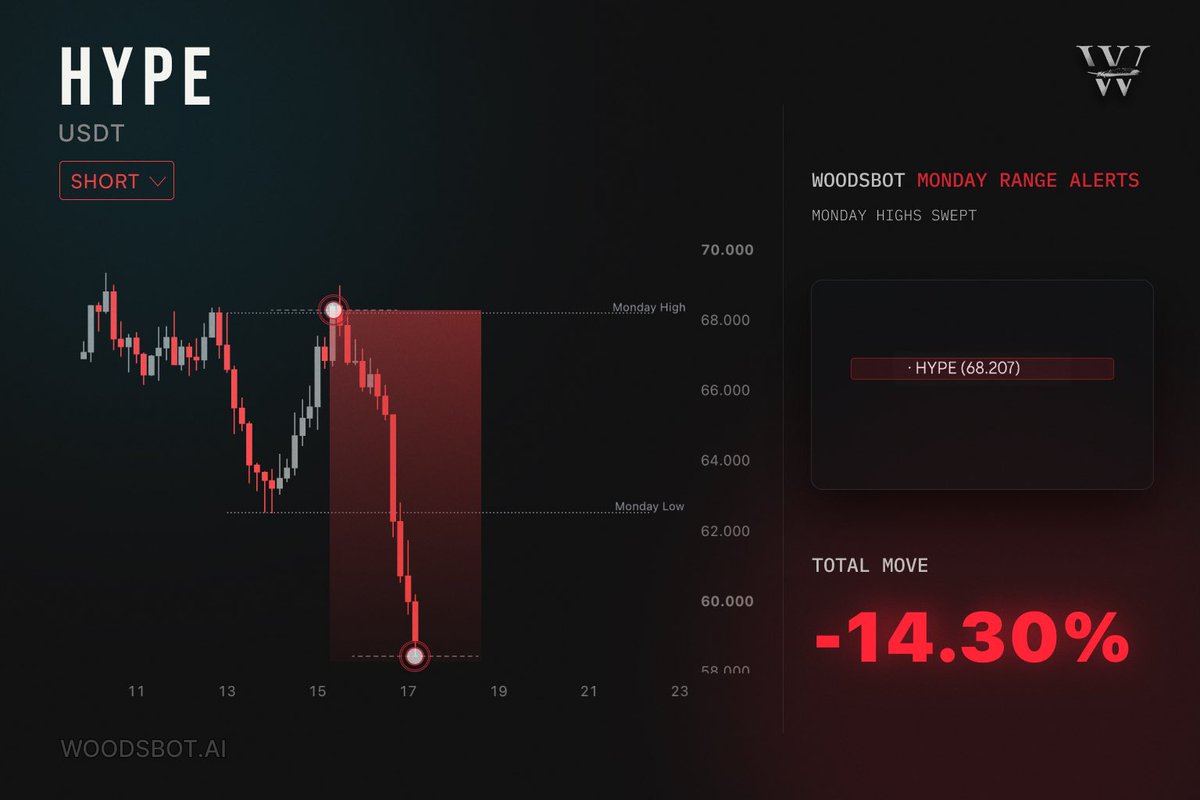
Our Monday Range bot caught hyperliquid:native high getting swept at 68.207. Price reversed hard, down over 14 percent inside the range without ever testing the low.
$BZ chopped for two days right where our trade alert bot had the entry set, then broke straight through to a new high without much resistance in between.
Watching charts 12 hours a day is not an edge. Emotions creep in, logic slips, consistency dies. The fix in this clip: map the levels with our indicator, set the alerts, let price come to you.
Top tier indicator doing top tier indicator things. Generational innovation. The Nike of Trading View Indicators.
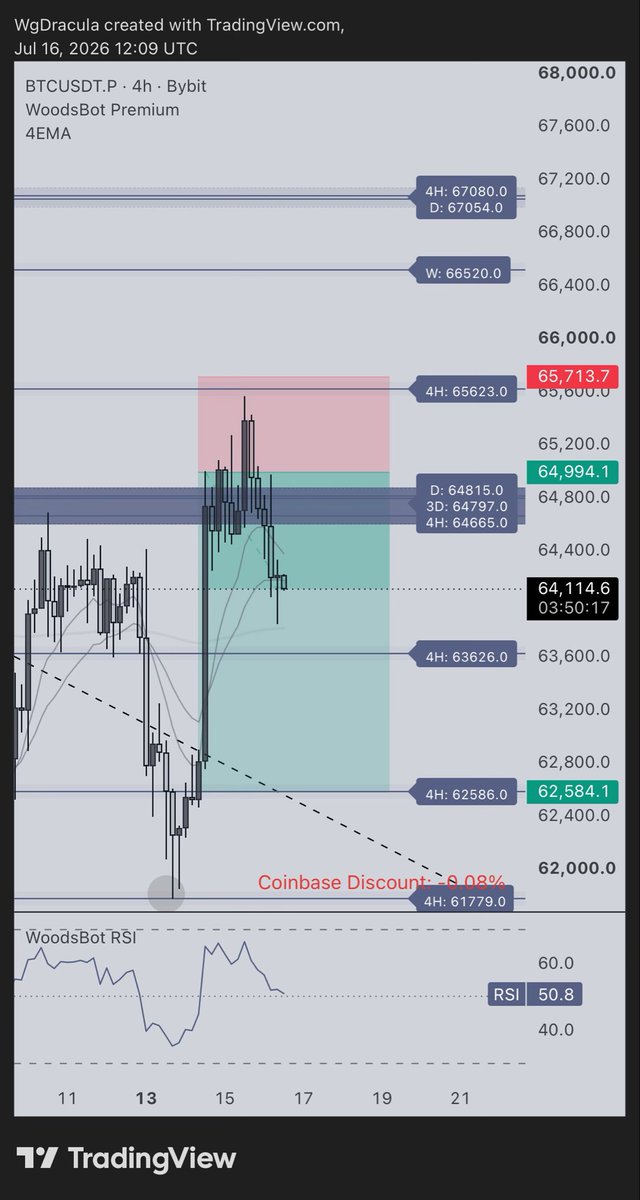
“@w00dsbot high confluence zone indicating short bias here bros.”
Our RSI Divergence bot caught ethereum:0x57e114b691db790c35207b2e685d4a43181e6061 overbought on the 30 minute, one of two names scanned. Price rejected from there and gave back the entire prior run.
Three tools, one chart. Support and resistance, RSI and OBV divergence, and Monday Range all reading together instead of three separate things to check.