No te pierdas mi último artículo: La escuela como infraestructura estratégica: una decisión que define el futuro de México https://t.co/mJxgCpa3yn vía @LinkedIn
No te pierdas mi último artículo: El laberinto de la vetocracia y el nuevo horizonte de la infraestructura estratégica en México https://t.co/Rw994j64EM vía @LinkedIn
No te pierdas mi último artículo: La importancia de desarrollar empresarios en las aulas de las Escuelas y Facultades de Ingeniería https://t.co/zULeLCHVpG vía @LinkedIn
No te pierdas mi último artículo: El Bosque del Agua: el corazón hídrico de la CDMX que la ingeniería civil debe proteger y potenciar https://t.co/Z429EpkkVI vía @LinkedIn
No te pierdas mi último artículo: Nearshoring, Turismo y Data Centers:
El Rol Estratégico de la Energía en el
Crecimiento de México https://t.co/aVoGdO1dxJ vía @LinkedIn
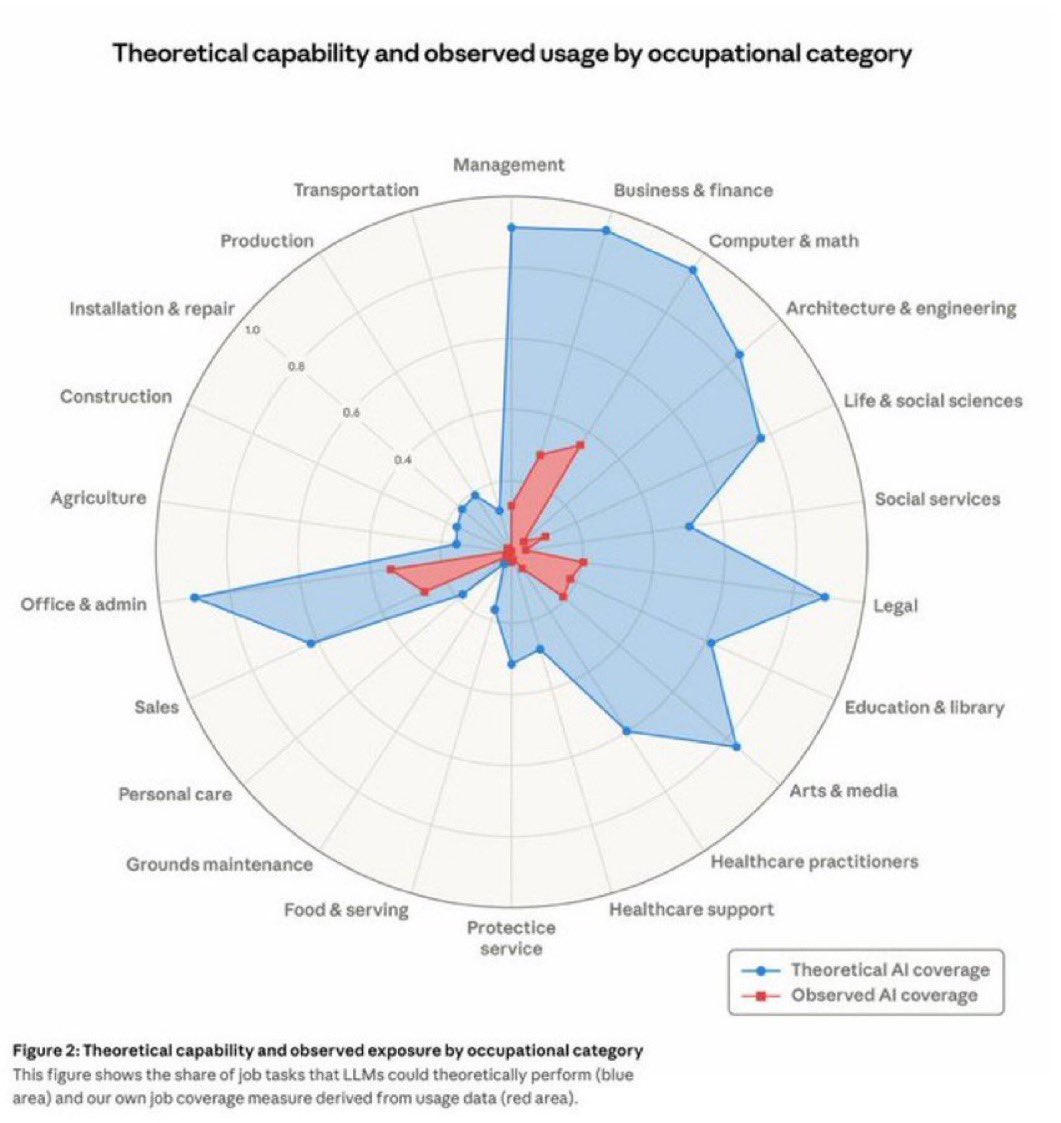
Anthropic's Revealing Chart on AI's Impact on Jobs
Anthropic has unveiled a pivotal chart that underscores the chasm between AI's capabilities and its real-world application in the workforce.
Derived from analyzing 2 million actual conversations with Claude, this radar chart, titled "Theoretical Capability and Observed Usage by Occupational Category," paints a stark picture of untapped automation potential across various job sectors.
At its core, the chart is a spider web diagram plotting occupational categories around a circular axis, with values ranging from 0 to 1.0 representing the share of job tasks.
The expansive blue area illustrates the theoretical coverage tasks that large language models (LLMs) like Claude could perform right now based on their inherent abilities. In contrast, the much smaller red area shows observed usage, drawn from real user interactions.
The visual disparity is immediate and profound: blue spikes outward significantly in fields like computer and math (reaching about 0.75), business and finance, and office administration, while red hugs close to the center, often below 0.2 across most categories.
This gap isn't just academic; it's a "career runway," as highlighted in discussions around the chart. For programmers, 75% of tasks are theoretically automatable, yet actual usage lags far behind.
Similar vulnerabilities appear in customer service, data entry, and financial analysis, roles traditionally seen as white-collar strongholds. Meanwhile, hands-on fields like construction, agriculture, and protective services show lower theoretical exposure, with blue areas dipping to around 0.1-0.3, suggesting AI's current limitations in physical or unpredictable environments.
Broader data amplifies the chart's message. As of early 2026, 49% of U.S. jobs expose at least 25% of tasks to AI, up from 36% a year prior. Yet, mass layoffs haven't materialized; unemployment in AI-vulnerable roles remains steady.
Instead, subtler shifts are underway: a 14% drop in hiring for 22-25-year-olds in exposed positions indicates companies are prioritizing experienced workers, shortening entry-level pathways for recent graduates.
The implications are clear: while AI's red footprint grows incrementally each month, the blue expanse signals accelerating change. College-educated, higher-earning professionals, once insulated are now most at risk, flipping the script on traditional labor disruptions.
Anthropic's chart isn't a doomsday prophecy but a wake-up call, urging workers and businesses to bridge the gap through adaptation, upskilling, and ethical integration of AI tools.
Please read the 5000 Days Series at https://t.co/tcKeuiQyql for answers on how you can thrive in the Interregnum.
No te pierdas mi último artículo: El Potencial Transformador de la Nueva Política Energética Mexicana:
Una Visión desde Aldesa México https://t.co/N33FFmI625 vía @LinkedIn
No te pierdas mi último artículo: Transformación digital de la ingeniería civil mexicana: La gran oportunidad para modernizar la contratación pública. Lecciones de España y LATAM. https://t.co/AhHNSwJQXi vía @LinkedIn