Now from today onwards you’ll stop searching for Chartink Scanners!
-52 Week Breakout Stocks
- 3 Week Tight Closing Stocks
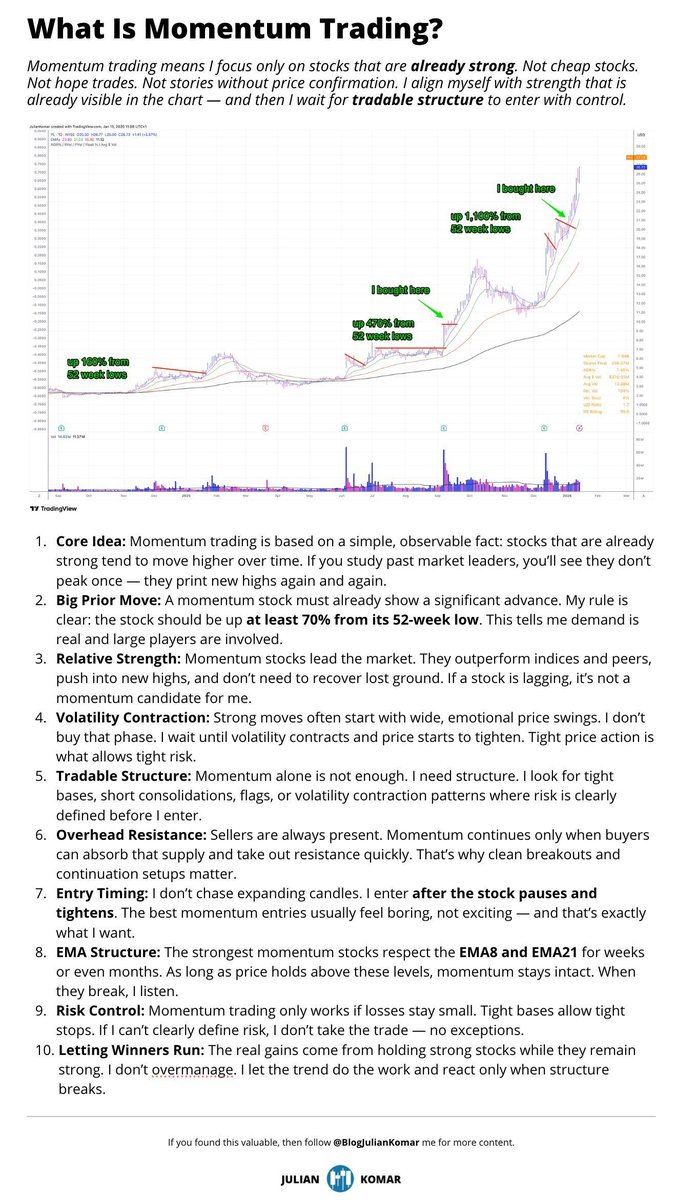
- Momentum Stocks
- Short Term Breakout Stocks
- And many more…….!
The most important thread 💯 🧵👇
(1) New 52 Week Highest Close
https://t.co/faeqlBR2tu…
(2) 3 Week Tight Closing Stocks
https://t.co/QMt8kq2sPe…
(3) Momentum Stocks
https://t.co/DPe2xe1aIS…
(5) HH&HL structure stocks
https://t.co/BqOGcGskvA…
(7) Stocks closing above 20 EMA.
https://t.co/lKNXX5X9OT…
(8) EMA based Supertrend Scanner
https://t.co/OcPFMNKUKZ…
(9) 5 Day Range Breakout
https://t.co/kMje0ia9Gi…
(10) Donchian Scanner
https://t.co/5egecRLhgY…
Hit “Re-Tweet” if you find this thread helpful & help your friends save their time & effort!🙏
Happy Trading:)
Everything that matters in swing trading, in one list.
Thank me after 1 year.
- Pick ONE core setup (momentum burst / VCP / EMA pullback / upside reversal whatever fits you) & master it before adding a second.
- Add ONE market filter. Know when Market is risk-on vs risk-off before you size up.
- Screen for RS & strong uptrend stocks only. Don't touch a falling knife as a beginner
- Learn to read a catalyst. No chart exists in isolation
- Risk 1-2% per trade & learn position sizing. 20% return means nothing at 2% allocation.
- Never average down ,it turns a small loss into a big one.
- Book partial profits systematically, trail the rest. Don't hope. This is biggest concern
- Create concentrated watchlist. Final list max 5 names
- Build a one pager for your process entry, stop, exit. If it doesn't fit on one page, you don't understand it yet.
- Run that process untouched for 50 straight trades. No mid-stream tweaks.
- Journal everything - trade, mindset, setups & review it weekly & monthly
- Ask questions. Out of 20 people you ask, maybe 1-2 reply that's still enough to clear half your confusion.
- Read widely early on. Books, articles, threads, blogs you're not learning setups yet, you're learning the language.
- Stop following anyone who dumps charts. Follow the ones who explain why, not the ones who create noise.
Try becoming elite version of yourself!
Discipline compounds faster than any setup ever will.
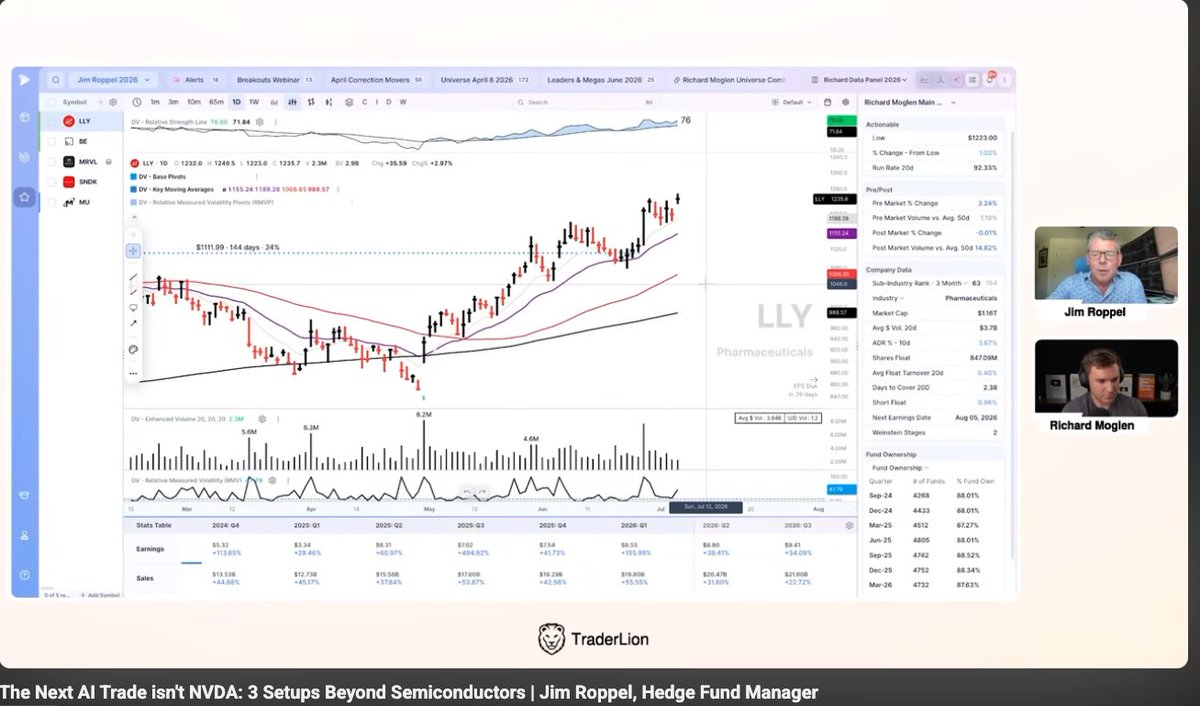
TraderLion Conference 2026- Jim Roppel
How to find new cycle leaders.
Process during a market correction:
1-Monitor the new high list
2-RS line making new highs during correction
3-First earnings season post-FTD = cheat code
4-Blowout earnings gap post-FTD = leader
5-Unknown name -by definition, not famous yet
6-Listen to people inside the disrupted industry
FTD = Follow Through Day.
"The magic elixir: monster earnings growth + true deep liquidity. Every big player has to go there."
If you’re struggling to identify A+ setups, stop overcomplicating it. Look for these characteristics:
1- 30%+ prior uptrend - stage 2 stocks
2 - 3–20 days consolidation/pullback
3- Narrow-range / inside bars near entry zone
4-Linear price action-clean, controlled trend
5-Price near 11/21/51 DEMA - best around 21 DEMA.
6-Volume dries up during contraction
7-Pocket Pivot- signs of accumulation
8-Sector tailwind or earnings leadership- not compulsory but it increases the odds.
A+ setup = prior strength + tight contraction + clean structure + controlled risk.
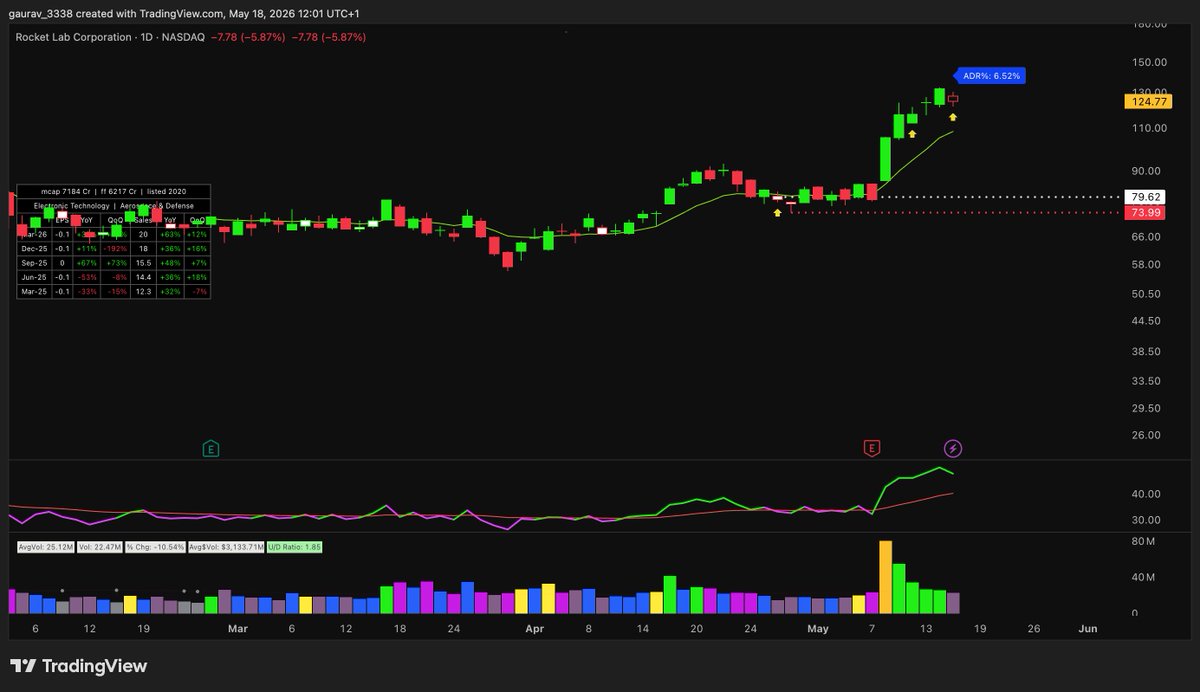
$RKLB
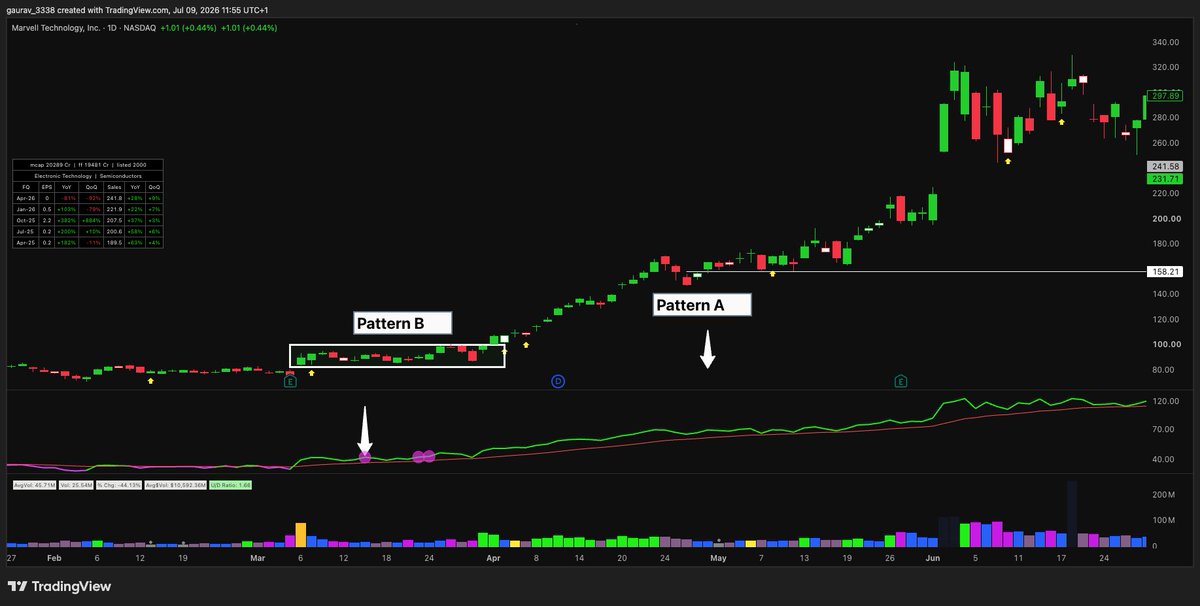
Relative Strength (RS) in Real Trade Scenarios
Zanger, Minervini, Qullamaggie, Darvas, William O'Neil
All different systems. All different eras.
One thing they all obsess over - Relative Strength.
Pattern A - Quiet Accumulation Tell
Price flat, RS rising - coiled spring
This is the most obvious one.
Price is going nowhere. Stock is in a tight range, maybe even slightly drifting down.
But RS line is climbing meaning the stock is outperforming the index while appearing to do nothing.
>What to watch for:
1-RS line making new highs before price breaks out - this is the tell
2-Base is tight: IB/NR7 days, inside bars, volume contracting
Trade application:
1-Highest-conviction Anticipation setup candidate
Stop: low of the base/candle
Pattern B - Early Stage Leader in New Bull Cycle
Follow-through day, first movers
Market is in a long term downtrend say Stage 4.
But somewhere in that phase, few stocks quietly stop falling. Stage 1 accumulation begins. Bases start forming. Right side volume starts appearing. RS lines start rising while everything else is still bleeding.
These stocks are telling you something before the market confirms anything. whose RS lines are already near 52-week highs despite the downtrend - are your cycle leaders.
What to watch for:
1-RS line was rising during market correction (stock held while index fell)
2-RS line at or near new highs at exact moment when stage turning
3-Stock breaking out of a base that formed during bear phase - not after it
3-Stock above 11WEMA
Trade application:
1-Filter for stocks with RS > 80 or Use RS Line Turning up after massive downtrend
2-First buys of new cycle ,small size initially, add as market confirms
3-Hold with patience ,early leaders in new bull run often become 200-500% stocks over next 12 months
If you use ADR% in your swing trading
Here's the scale I go by:
<2% : Cleanest chart in the world won't pay you. Dead.
2-3% : Too slow for swing trading.
3-5% : Workable zone. Decent range to trade (Indian market, this is what you will get most).
5-8% : Sweet spot for momentum, where most big winners live before they run.
8%+ : Highly wild. Huge opportunity, but violent. Book hard after a decent gain or it will shake you out.
SanDisk was running ~8% ADR, MTAR ~6%, Cupid ~5%, all in the momentum sweet spot before their explosive moves.
Rule of thumb: Aim for 5%+ for swing trades. For the Indian market, maybe 3-4%.
Want a better win rate in swing trading?
First Fix Your Universe & Buy Stage 2 stocks only.
Stage 2 stocks are:
1 - Within 10-20% of its 52-week high
2 - Price Equal/above rising 21/50 DEMA
3 - 30%+ move in the last 3 months
Apply any one filter & you keep funneling into Stage 2 names.
But,This is just step 1.
Then comes your setup, Base, EMA alignment, contraction, catalyst etc.
Stage 2 gets you the right universe.
The setup gets you the entry.
First Fix Your Universe
Chart-#BlissGVS
If you are struggling with swing trading, switch to positional trading.
Especially now, if the market is entering a strong bull phase, you don’t want to mess around with noise.
Positional trading gives you more room, less noise & better chance to ride big trends.
My core framework is simple:
Screen → Technical → Fundamental
1-Start with companies showing earnings strength.
My base filter: Minimum 50%+ YoY earnings growth
Keep the universe tight: 40–50 names only
2-Check technical strength
Move all shortlisted names to TradingView & open weekly chart. Look for:
1-Stage 2 or prior strong uptrend
2-Clean base pattern
3-Support near 11WEMA
4-Near 52WH / ATH
3-Entry
Enter after:
-Base breakout
-Range breakout
-Tight weekly candle breakout
Same concept as daily chart breakouts
4-Add conviction through fundamentals
Once the chart confirms strength, check:
-Catalyst longevity
-Balance sheet quality
-Guidance + execution
Don’t overcomplicate swing stock selection.
If you want to simplify your stock universe, focus on just 4 things:
within 15% Near 52-week or all-time highs
+
Strong ADR
+
High relative strength
+
Tight Contraction near key EMAs like 21 DEMA
That’s it.
Sometimes, slightly imperfect setup on a true market leader can make serious money.
Every crisis in the market teaches you only one lesson that we invariably forget when the next one arrives.
And its the same lesson everytime: Arrange your affairs in such a way that you can comfortably stick around till the storm passes.
And a bonus second lesson that many never seem to realize - when the newsflow is bad for a while - most of the negatives are already priced in by the market fairly quickly. If you act late, in general, it's best not to act at all.
And a third lesson - market rallies in the face of uncertainty, by the time certainty comes, the market would have priced in the resolution.
We need to remember and review these when we face the next crisis.
Jefferies report interesting read.
Basically saying one thing clearly: AI data center demand is not the problem. Physical supply is the bottleneck.
The world wants far more data center capacity than the ecosystem can build and commission fast enough.
The cleanest theme: AI infrastructure bottlenecks and their beneficiaries.
The best names are the ones sitting at real choke points where demand is exploding but supply cannot scale easily.
Key buckets:
Cooling: $VRT, $CARR, $TT, $JCI
Power equipment / transformers / grid: $GEV, $ETN, $WCC
EPC / construction: $PRIM, $MTZ, $PWR
Data center capacity owners / developers: $DLR, $EQIX, $CORZ, $WULF
Hyperscalers: $AMZN, $MSFT, $GOOGL
The big takeaway:
The next layer is physical infrastructure:
power, cooling, land, construction, grid, and capacity.
That is where the real bottleneck sits.
Market Breadth Tool
Added the Market Breadth tool into my weekly routine and have been using it for the past 3-5 months.
Mainly for 3 reasons
-Gauge overall market health
-Confirm trends
-Identify potential reversals
Using the dashboard shared by @soicfinance sometime last year. Thanks!
https://t.co/iPZLLR0WEb
4 Key widgets I follow:
% Stocks above 20 EMA (Short-term Trend)
% abv 50 SMA (Mid-term Trend)
%age of Stocks Making a 52 week High
Where is the Money going: Every Month
Use your own creativity & data interpretation skill to understand this dashboard
Insights and Examples:
-Image below is % of stocks abv 50 EMA chart
-Use it gauge midterm trend (6-12 months)
Trend Following:
For instance, observing the % of stocks above 50 EMA:
-Above 50% suggests bullish sentiments
-Below 50% indicates bearish sentiments
Market Timing:
-Over the past 2 years, percentages around or above 80% during an uptrend has been followed by pullback or correction, a caution zone.(Market we are in currently)
-Conversely, percentages dropping below 20% during a downtrend hint at potential reversals to upside.
-Notably, from mid-April to June 2024, there was a recovery phase with percentages around 80%, followed by another bearish phase as percentages dropped below 20%.
Trend Reversal:
-Data indicates market peaks typically occur when the percentage is within the 70%-90% range.
-Market bottoms seen when the percentage falls within the 10%-20% range during a downtrend.
-Check dates and compare with indexes for deeper insight.
Key Pointers-
-Helps to stay informed about the market from a broader perspective since following NIFTY alone doesn't provide enough depth due to its limited number of stocks.
-Buying or selling decisions can't be based solely on this; other technical and fundamental parameters need to be aligned.
-Short term term trend, 20EMA can be used for similar insights
-Combine 20/50 and 200 EMA to get better insights
- If anyone has a better way to analyze this market breadth, feel free to comment or DM me
@MashraniVivek
This is probably one of the simplest but most powerful Swing scanners I use to find real momentum leaders.
If you struggle to narrow hundreds of stocks down to a few serious candidates, start with a 52-week high filter.
Some of my best winners first appeared through this kind of scan - names like CUPID, HINDCOPPER, AVALON, $RKLB, $SNDK, $MU etc.
My base filter:
1-Common stocks only
No ETFs. No preferred shares. No messy instruments.
2-Primary listing: Yes
Avoids duplicate listings and unnecessary noise.
3-Market cap > $1B
Big enough to avoid illiquid junk.
Small enough to still move.
4-Price × Volume > $10M
Liquidity matters.
I want names where real money is active.
5-ADR > 4%
A stock that barely moves is usually dead capital for my style.
Ideally, I prefer ADR in the 5–8% zone, but 4% is my minimum filter.
6-Within 0–10% of 52-week high.
I want names already showing strength near leadership territory.
That’s it.
How I use this scanner:
Once the names appear, I manually go chart by chart and ask:
-Is the stock in a clean uptrend?
-Is it near a proper breakout or pullback zone?
-Is volume tightening?
-Is the stock tightening with some tight candles?
-Is relative strength improving?
-Can I define risk clearly under my stop?
Frequency:
Sometimes I scan daily.
Mostly, I scan seriously when a position is closed and capital is available.
I usually don’t hold more than 3-4 swing positions.
The goal is to reduce the market to a small list of elite stocks, then wait patiently for my setup.
The hard part is not finding stocks.
The hard part is waiting for the right structure inside the right stock.
I was trying to understand the end-to-end AI flow from user demand to the full infrastructure chain behind it.
This is what I understood and concluded:
SIMPLE MENTAL MODEL:
Example: When you log in and ask ChatGPT a question
→ ChatGPT creates usage
→ usage creates cloud demand
→ cloud demand creates data-centre demand
→ data centres create power, cooling, server and networking demand
→ servers create GPU demand
→ GPUs create demand for HBM memory, optical networking and chip design
→ chip design creates foundry demand
→ foundries create equipment, packaging, materials and chemical demand.
This is How end to end Looks:
→ ChatGPT / AI App
(OpenAI, Microsoft Copilot - $MSFT)
Role: User-facing product where AI demand starts
Why next layer is needed: When you log in and ask ChatGPT a question, the app needs massive compute somewhere else to process it.
Profit pool: Medium to High
→ Cloud Platform
(Microsoft Azure - $MSFT, AWS - $AMZN, Google Cloud - $GOOGL)
Role: Runs ChatGPT and enterprise AI workloads
Why next layer is needed: Cloud platforms need physical infrastructure to host GPUs, servers, storage and networking.
Profit pool: Very High
→ Data Centres
(Equinix - $EQIX, Digital Realty - $DLR)
Role: Physical buildings where AI compute runs
Why next layer is needed: Data centres consume huge electricity and generate huge heat, so they need power, cooling and grid support.
Profit pool: High
→ Power / Cooling / Grid
(Vertiv - $VRT, Eaton - $ETN, GE Vernova - $GEV)
Role: Keeps AI data centres powered, cooled and operational
Why next layer is needed: Once power and cooling are available, the data centre needs AI server racks to actually run AI workloads.
Profit pool: Very High and rising
→ AI Servers
(Dell - $DELL, Super Micro - $SMCI, HPE - $HPE)
Role: Server racks built for AI workloads
Why next layer is needed: AI servers need specialised chips because normal CPUs are too slow for large AI models.
Profit pool: Medium
→ GPUs / AI Accelerators
(Nvidia - $NVDA, AMD - $AMD)
Role: Main AI compute engine
Why next layer is needed: GPUs need ultra-fast memory to feed them data quickly, otherwise compute power gets wasted.
Profit pool: Extremely High
→ HBM Memory
(Micron - $MU, Samsung - $005930.KS)
Role: Ultra-fast memory needed by GPUs
Why next layer is needed: Thousands of GPUs must communicate with each other, so they need high-speed networking.
Profit pool: Very High
→ Networking / Interconnect
(Broadcom - $AVGO, Arista - $ANET, Marvell - $MRVL, Nvidia - $NVDA)
Role: Connects thousands of GPUs, servers and racks together
Why next layer is needed: High-speed networking needs optical fibre, optical modules and transceivers to move huge data with low delay.
Profit pool: Very High
→ Optical Fibre / Optical Modules / Transceivers
(Corning - $GLW, Coherent - $COHR, Lumentum - $LITE)
Role: Nervous system of AI data centres - moves huge data at high speed
Why next layer is needed: All these AI chips and networking chips first need to be designed by specialist chip companies.
Profit pool: High and rising
→ Chip Design / Custom Silicon
(Nvidia - $NVDA, Broadcom - $AVGO, Marvell - $MRVL, AMD - $AMD)
Role: Designs GPUs, ASICs, networking chips and AI accelerators
Why next layer is needed: Chip designers usually do not manufacture the chips themselves, so they need foundries.
Profit pool: Extremely High
→ Foundry Manufacturing
(TSMC - $TSM, Intel Foundry - $INTC)
Role: Manufactures advanced chips designed by Nvidia, AMD, Broadcom etc.
Why next layer is needed: Foundries need advanced packaging to combine GPUs, HBM memory and substrates into usable AI chip systems.
Profit pool: Very High
→ Advanced Packaging
(TSMC CoWoS - $TSM, Amkor - $AMKR, ASE - $ASX)
Role: Combines GPU + HBM + substrate into powerful AI chip packages
Why next layer is needed: Foundries and packaging plants need highly specialised machines to manufacture advanced chips at scale.
Profit pool: High to Very High
→ Semiconductor Equipment
(ASML - $ASML, Applied Materials - $AMAT)
Role: Machines required to manufacture advanced chips
Why next layer is needed: These machines need wafers, chemicals, gases and materials to actually produce chips.
Profit pool: Very High
→ Materials / Wafers / Chemicals / Gases
(Entegris - $ENTG, Linde - $LIN, DuPont)
Role: Raw materials and process inputs needed to make chips
Profit pool: Medium to High
Focus should be on these segments:
These have high profit pool strength
-GPUs / AI Accelerators
-Chip Design / Custom Silicon
-Cloud Platforms
-HBM Memory
-Networking / Interconnect
-Semiconductor Equipment
-Power / Cooling / Grid
-Foundry Manufacturing
For a long time I thought macro was useless. Mostly because it can’t be predicted.
But as I spent more time with the markets I figured , it’s the macro that drives a big part of portfolio return. Stock picking is just the details.
Predicting is not necessary and often futile. But just understanding the macro environment and importantly anticipating the change in variables (is a trend likely or mean reversal) probably helps a lot.
The most important variables both India and globally to track are:
Interest rates/yields
Inflation or deflation regime
Credit and liquidity conditions
Currency
Crude/Energy
Precious metals
Industrial commodities
Fed and central bank actions
Global capital flows - risk on/off
Adding this to our toolkit will make us all better investors (and traders).
A Few Powerful Frameworks to Identify High-Potential Businesses 👇
For core positions,I look for a cluster of evidence -business strength, earnings triggers, sector tailwind, growth catalysts, and price confirmation.
Some of the strongest frameworks:
-TAM expansion
-Market leader in a niche category
-Clear earnings catalyst -new product, new market, turnaround quarter
-Capex moving from spend to utilisation
-Margin expansion +operating leverage +debt reduction
-Entire sector making new highs
-Bear-market accumulation before a new cycle starts
-Promoter/insider increasing stake
-PEAD
-Revenue acceleration from a new demand cycle
-Backlog, order book, or major contract wins
This applies across India and US.
The biggest winners usually don’t come from one framework.
They come when multiple frameworks overlap in the same business.
Recently I started digging into the nuclear industry after reading a few sharp people here on X & also noticing how many post-war countries are exploring nuclear as a stronger long-term clean energy path.
My biggest takeaway so far: India still does not have a clean listed pure-play nuclear story. Just like AI or data centre themes, most listed names with nuclear exposure seem to have very small current revenue contribution likely<5% mostly buried inside larger engineering, civil, pumps businesses.
So for now, only way to play like a pick-and-shovel strategy & it might work as there is policy push now building in India:
-100 GW nuclear target by 2047
-20,000 crore Nuclear Energy Mission
etc etc
A few India names looks INteresting
1. MTAR Technologies -probably one of the more visible listed nuclear stories in India right now. Still not a pure-play, but among the better names.
2. L&T -not a pure-play, but likely the highest-quality India proxy. Nuclear is a small part of a much larger machine, but one of the most credible beneficiaries.
3. HCC - current contribution looks small, but it has real nuclear civil execution history and could benefit if larger reactor civil packages
4. Kirloskar Brothers - not talked about enough. Nuclear is still not a big revenue driver today, but their pump qualification and long-standing work
On the other hand, the US market already has listed names directly benefiting from the theme.
A few that look interesting:
1. Cameco -probably the cleanest broad nuclear play. Roughly 98.6% of reported revenue came from its two core nuclear businesses: uranium and fuel services.
2. Centrus Energy -one of the most important names in the U.S. fuel chain because of enrichment and HALEU. Almost all of its revenue is tied to nuclear-related business.
3. Constellation Energy - direct nuclear power generation exposure at scale,discussed in the AI / data-centre power context. it owns about 22 GW of nuclear capacity and its nuclear fleet produced 182 TWh in 2024.
4. BWX Technologies - not flashy, but a very serious nuclear infrastructure business with exposure to naval nuclear
Still researching, but one thing is clear:
Theme is still early in India. If policy intent converts into real orders and execution, a few of these supplier names could become very interesting over the next 3–5 years.
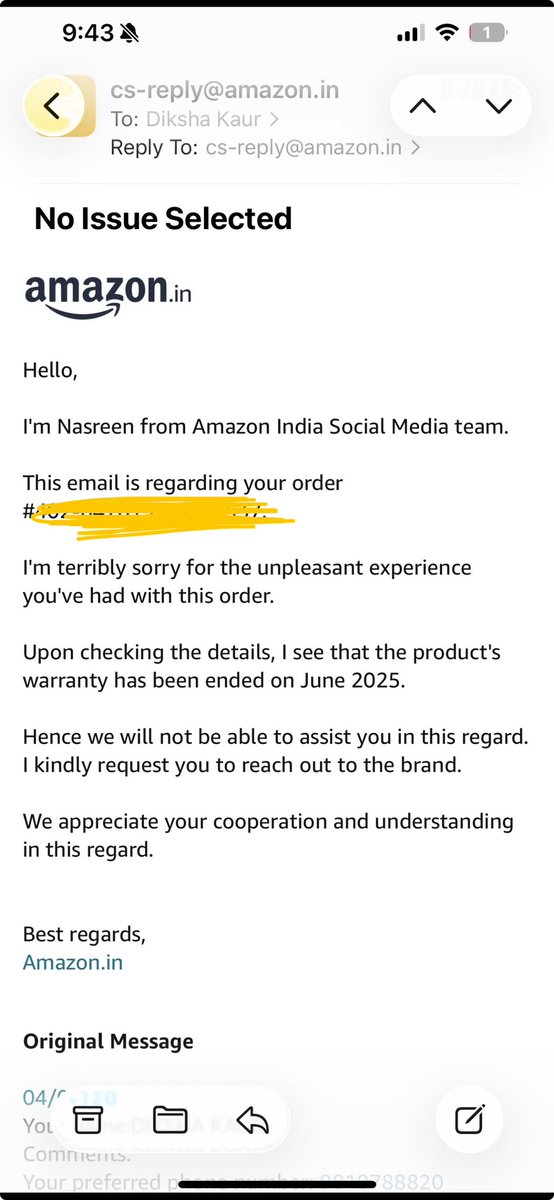
@AmazonHelp Putting up again as Indians must know how @amazon treats Indian residents. As an American, I definitely know this would not fly in the US and Amazon US would have done everything to sort out the issue. @amazondotin
Bought a battery pack from @amazonIN from the @Portronics@Jasmeet93473188 brand. Blew up and part of my bed on fire as well as damaged and burnt some wooden flooring. No response after repeated emails and calls to Portronics. No accountability, no taking ownership of the issue.