If you're interested in finance, want the most relevant news and well-thought-out analysis, this is for you!
Focusing on technical analysis, you can learn a lot and also get to know how I combine it with both fundamentals and the macro cycle.
Follow me and get free trade ideas!
@TempoICT I’m too scared often times to take trades from sub 1m timeframes. So the crazy RR isn’t there most of the times. Took it too from the 1m though
Bottom could be in for $BABA!
· Structure looks good
· Good bounce off a retracement level
· Short-term indicators suggest upside potential, with longer-term indicators also not looking bad
· 50-week MA was hit today, in combination with the 88.2% Fib retracement
As always, I wouldn’t care too much about those lower timeframes, but chances are good for a sustainable move to the upside.
$PM moving from target zone to target zone right here. Didn’t enter because I didn’t get the perfect entry—my target price basically just wicked my zone 3 times and I wasn’t convinced.
Right now I’m pretty sure my primary scenario is in play, as all these overlapping moves to the upside so far don’t really suggest an impulsive move.
What makes me a bit unsure are my indicators, which already look like they could have topped out. That would argue we’re currently in wave 5 and on the way to a cycle top.
Just realized I never showed you my $NFLX chart. So for given occasion I’ll talk about it today.
5% drawdown so far today as Paramount raises its offer for Warner Brothers.
Elliott wave wise, this doesn’t look too good and this wave 4 we’ve seen so far is hard to count.
But with these C waves, the substructure isn’t the most important thing.
- Targets are reached (might get run through though)
- Indicators look very bullish
- Fundamentals are right
- I’m buying!
But as you know, I’m careful with US assets as my mid and long-term expectations for American indices are very bearish. So in my opinion, careful stock picking and reduced allocation are important.
NFA!
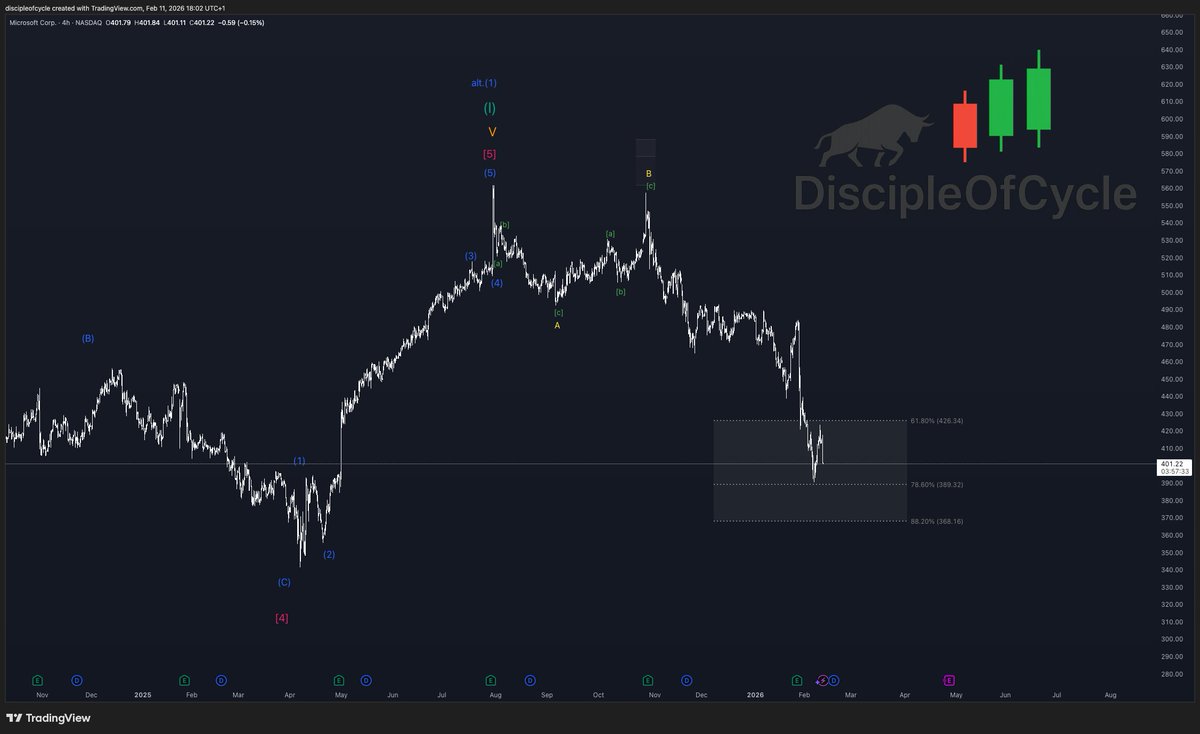
On we go with my MAG 7 charts. Today I’ve got $MSFT for you.
As you can see, I think the top is in for this one. We found support after the earnings sell-off perfectly at the 78.6% Fib retracement in my alternative target zone. But I still don’t believe another sustained upside move is likely, especially with indicators shouting that a top has already formed.
It’s possible we’ll see a wave B soon that could theoretically make a new ATH, but that’s pretty unlikely.
I won’t touch Microsoft in this cycle anymore, and if I do, it will be a short trade.
I expect a major correction in both time and price—prices below $200 wouldn’t surprise me.
This recent move in $NVDA raises some questions for me.
It’s a very impulsive move, suggesting a first wave 1 and, with that, a completed wave 4 which would most likely also mark the bottom in $NQ.
Honestly, I’d rather have seen this move to the downside clearly finish wave 4. A deeper correction would also create a better base for another sustained move to the upside.
I might get rid of my hedge shorts in Nasdaq, currently slightly in profit.
Probably the most discussed stock on X right now: half the people are trying to catch the knife, the other half thinks $HIMS will go bankrupt. As usual, there’s too much emotion and too little objective analysis, which is why I’m sharing my thoughts today—emotions set aside.
- The main part of my analysis is always Elliott Wave. No matter how you count it, this clearly doesn’t look like a bottom anywhere near. A short-term bounce or consolidation is likely to form wave 4 before another leg lower.
- Indicators don’t look like a bottom either. Especially the monthly and two-week indications aren’t suggesting a major bottom, which is very meaningful. Weekly charts and below show some bounce potential, but I wouldn’t weigh that heavily—it aligns perfectly with my wave 4 expectation.
- The only thing hinting at a nearer bottom is the extremely poor sentiment combined with the 200-week and 50-month MAs, but this can also support my wave 4 view.
All in all, downside potential is favored, and I’m still not buying—though I’d love to.
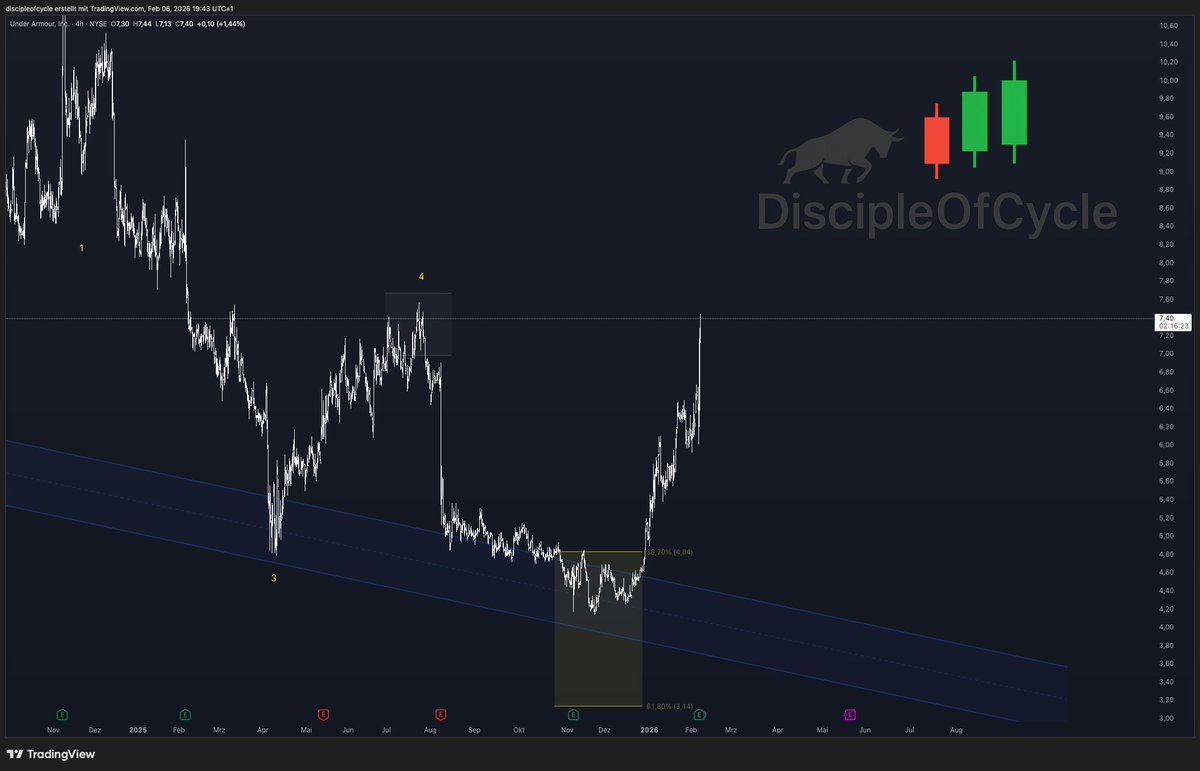
$UAA is accelerating. Already 50% up from the top of my target zone.
Catalyst: good earnings report. Negative EPS expected turned into +0.1.
Structure is very bad and I’m not invested yet. I’m pretty sure of at least another deep wave 2 or even new lows. So far I’m just watching.
Historical values for the CoinMarketCap Fear and Greed Index.
Usually I feel like this one lags a bit and is often times higher than the others, but not this time.
The one from https://t.co/rL423u3MY5 is at 9 points, the lowest value since June 2022. That wasn’t the bear market bottom, but the FTX crash.
In combination with indicators like RSI, liquidation levels, on-chain data, and so on, there are many signs that usually mark a major bottom.
Let’s see what happens this time!