Data for a diverse and equitable future. Measuring child wellbeing and conducting policy analysis to document opportunity and equity among U.S. children.
The Child Opportunity Index 3.0 is here! The new COI measures and maps neighborhood features that matter for children—like quality schools, clean air, health care & economic security. See what the data teaches us about equity in neighborhood opportunity. https://t.co/qVp8RAGUSO
Exciting news: Dr. Dolores Acevedo-Garcia and the Institute for Equity in Child Opportunity & Healthy Development (IECOHD) join BU School of Social Work! @diversitydataki https://t.co/naMPAHqxK4 https://t.co/2tNKtbaEdF
New research using the Child Opportunity Index finds neighborhood opportunity is correlated with preterm birth rates, worsening racial/ethnic health inequities. By @DAcevedoGarcia, Candice Belanoff @BUSPH, Adriana Black, Collette Ncube & Joanna Almeida
https://t.co/qgllN2PJ6K
Work affects health—and supportive work environments and policies can positively impact the health of workers, children and families. Listen to our policy director Pamela Joshi share her thoughts @BUSPH_MCHCenter:
https://t.co/c6BX8sOAUF
DYK: Children in very low Child Opportunity Index (COI) neighborhoods experience more than 60k excess hospitalizations annually. To combat these issues, children’s hospitals invest in community health programs.
Learn about the solutions during #CHIWeek: https://t.co/Icy8jStkcM
Pediatric Heart Transplantation: Children living in lower 'Child Opportunity Index' zip codes had poorer waitlists and one-year post-transplant survival. 🫀
🔗: https://t.co/aPqxkBULCG
A new study led by UC Davis researchers finds that neighborhood factors like poverty and a lack of services are associated with increased ADHD symptoms in children.
https://t.co/g7ZpSSW7VH
A big thank you to @jdickerson for chattering about the Child Opportunity Index in this week's episode! Check out how neighborhood resources differ between and within metros—and why that matters for healthy child development: https://t.co/qVp8RAGUSO
Political Gabfest: Donald Trump faces his first criminal trial; Supreme Court considers charge related to another Trump case; The Atlantic’s Mark Leibovich finds Gavin Newsom can’t help himself. https://t.co/nb6aTd2r25
Study: Texas, California towns with large Latino populations offer few childhood opportunities compared to national averages. 📊👧👦
#ChildhoodOpportunities#LatinoCommunities
Read more here⬇️
https://t.co/iQ8KSLoJaa
Bridgeport, Connecticut; San Jose, California; and Boston have the highest overall childhood "Opportunity Score" among the country's 100 biggest metros.
• McAllen, Texas; Brownsville, Texas; and Visalia, California have the lowest. https://t.co/Ne0yiFWwO4
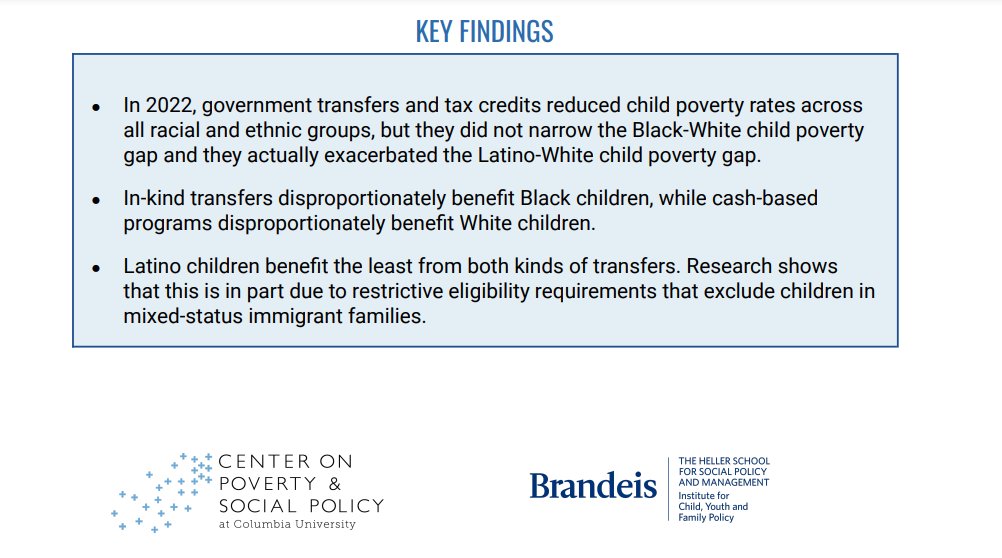
In a collaboration with @CpspPoverty, we find that, due to restrictive eligibility requirements, government transfers & tax credits exacerbate the Latino-White child poverty gap, widening racial/ethnic inequities. Check out our new brief:
The Role of Government Transfers in the Child Poverty Gap by Race and Ethnicity: A Focus on Black, Latino, and White Children
via @CpspPoverty & @TheHellerSchool https://t.co/oEKRchL9f4
@NPHW Prioritizing health equity is at the forefront of everything we do at @RWJF. The Child Opportunity Index can be used to inform policies to ensure every child has access to quality education, safe housing, and nutritious food. (1/2) #NPHWChat
https://t.co/CQmBSenMGv
A data visualizer from @diversitydataki shows that compared to White and Asian children, Black and Hispanic children tend to live in neighborhoods with far fewer resources for healthy development. Check out your own city here: https://t.co/ruYbCO0GUI #equity
What we're reading: New report from @FPGInstitute uses the Child Opportunity Index to identify policies & strategies to mitigate racial & economic inequities in early care and education. Neighborhood-based tools can help generate policy solutions in #ECE https://t.co/a2Ghxfi8Dn
First findings from COI 3.0 reveal a difference in life expectancy of 6 years between typical residents in very low-opportunity neighborhoods (76 years) and in very high-opportunity neighborhoods (82 years). See the gap in your metro area: https://t.co/GWNVYi1oQP
First findings from the COI 3.0: Wide inequities in neighborhood opportunity exist across—and within—metro areas, and for children of different races/ethnicities. Our report shares why this matters for the health of our children and society: https://t.co/KsH1q1QQyn
Key features of the new COI 3.0:
⭐️Data for every U.S. neighborhood (census tract)
⭐️Data for every year 2012-2021
⭐️New indicators incl. measures of broadband access, housing quality & social capital
⭐️Improved measures of green space & school quality
https://t.co/fE6MIK09cz
JUST RELEASED | New theme issue on #HousingAndHealth, including housing quality and insecurity, homelessness, health equity, and what policy interventions may successfully address challenges. Read the Editor's introduction and explore the full issue: https://t.co/HWcp8VcymL