Strategy has acquired 24,869 BTC for ~$2.01 billion at ~$80,985 per bitcoin and has achieved BTC Yield of 12.6% YTD 2026. As of 5/17/2026, we hodl 843,738 $BTC acquired for ~$63.87 billion at ~$75,700 per bitcoin. $MSTR $STRC https://t.co/y1zvePEuym
The Bitcoin 200-week MA is the smoothest, most reliable signal in finance.
It has never had a down year in 12 years of measurement.
The question is where it goes from here.
I ran three independent models on 4,386 daily observations of Bitcoin's price.
Different assumptions, different functional forms, different decay mechanisms.
The question I wanted answered: what does this thing look like in May 2030 and May 2034?
MODEL 1 - POWER LAW
Fit log(200W MA) against log(days since genesis):
log(MA) = -41.18 + 5.986 · log(days)
R² = 0.9812.
98% of the variance in the smoothed log price is explained by the log of time.
Twelve years of data, one parameter doing all the work.
The exponent of ~6 tells you the 200W MA grows roughly as the sixth power of time.
Every doubling of Bitcoin's age compounds the smoothed price by 64x, but doublings of age happen less and less often. Deceleration is baked into the math.
May 2030: $260,579
May 2034: $727,704
MODEL 2 - BOUNDED EXPONENTIAL DECAY OF YoY GROWTH
Model the YoY growth rate of the 200W MA, not the MA itself.
Fit: YoY(t) = 5% + 122% · exp(-0.080 · t)
Long-run floor: 5%. Half-life of excess growth: 8.7 years.
In ten years YoY lands at 26%. In twenty years, 14%.
Floored at 5% because the 200W MA has never had a YoY reading below +19% in any observation, so asymptoting to anything lower is statistically unsupported.
Compound that decaying YoY day-by-day forward:
May 2030: $269,940
May 2034: $870,654
MODEL 3 - CYCLE-PEAK DECELERATION RATIO
Run peak detection on the daily YoY series. Two cycle peaks emerge:
May 2018: YoY +345%
Dec 2021: YoY +143%
Decay ratio: 0.414.
Each cycle's peak compounds at ~41% of the prior cycle's peak... the halving structure expressed in returns space.
Project forward with the same ratio and the cycle-aware structure (peaks ~18 months post-halving, troughs ~36 months post-halving):
Next peak Oct 2029: YoY +59%
Peak after Oct 2033: YoY +25%
Some critical honesty here... this model has exactly ONE observed decay ratio, so it carries the most uncertainty.
But the geometric structure is consistent with the power-law slowdown, and it gives a third independent perspective.
May 2030: $193,840
May 2034: $393,950
Median across three models:
May 2030 200W MA: ~$261K
May 2034 200W MA: ~$728K
Models 1 and 2 land within 4% of each other for May 2030.
Model 3 is meaningfully lower because the target dates fall on the down-leg of the next cycle.
The range spans $194K to $270K for May 2030, $394K to $871K for May 2034.
What does this mean for the spot price of Bitcoin?
The MA is the gravity line. Spot oscillates around it.
Across full cycles, spot has traded 0.65x to 2.5x the 200W MA. Both target dates fall ~7 months after projected cycle peaks, putting expected spot in the 0.8x to 1.4x range.
May 2030 spot band: $183K (drawdown) to $521K (peak zone)
May 2034 spot band: $510K (drawdown) to $1.46M (peak zone)
The Bitcoin bears need the 200W MA to do something it has never done: print red.
Hyperbulls calling for $2M by 2030 need the YoY decay to reverse, which has never happened cycle-over-cycle in any observation.
The honest base case sits between those extremes.
The 200W MA goes to ~$260K by May 2030 and ~$730K by May 2034.
Spot tracks somewhere between 0.7x and 2.0x that line depending on where you sit in the cycle.
Million dollar Bitcoin by 2034 isn't a moonshot at all.
At a normal cycle multiple, it's the central forecast.
Buy the floor. Hold the line. Compound.
🔥STRATEGY IS UNSTOPPABLE🔥
In the last year, Strategy has gone from 538,200 Bitcoin to 815,061 Bitcoin.
They added 50% to their Bitcoin stack in a down year for Bitcoin.
A year ago there were 314,216,000 shares outstanding.
Now there are 381,588,000 shares outstanding, which is a 21.44% increase.
That is the whole game.
They diluted the share count, but they grew the Bitcoin stack so much faster that each share still ended up backed by materially more Bitcoin.
Even though shares outstanding rose 21.4%, Bitcoin per share still rose 24.7%.
Keep in mind, the bears are too stupid to understand this.
Instead of letting short sellers drive down the stock price to NAV value, they sold into the market to get more Bitcoin exposure for the shareholders.
And when Bitcoin runs again, amplified Bitcoin holders will be rewarded immensely.
10/10. No notes.
John D. Rockefeller did not invent oil. Michael Saylor did not invent Bitcoin.
What they both understood was that controlling the best asset was not enough. You had to build the machine around it.
Rockefeller built refineries, rail deals, pipelines, and distribution. He took raw oil and turned it into an empire.
Saylor is doing the same with Bitcoin. He is building capital structures, preferred shares, debt markets, ETFs, and public equity around the hardest asset on earth.
Rockefeller accumulated oil before the world fully understood how valuable it would become. Saylor is accumulating Bitcoin before the world fully understands what it is.
One built the empire of industrial energy.
The other is building the empire of digital energy.
The playbook is the same: acquire scarce assets early, build the infrastructure around them, and let the rest of the world arrive late.
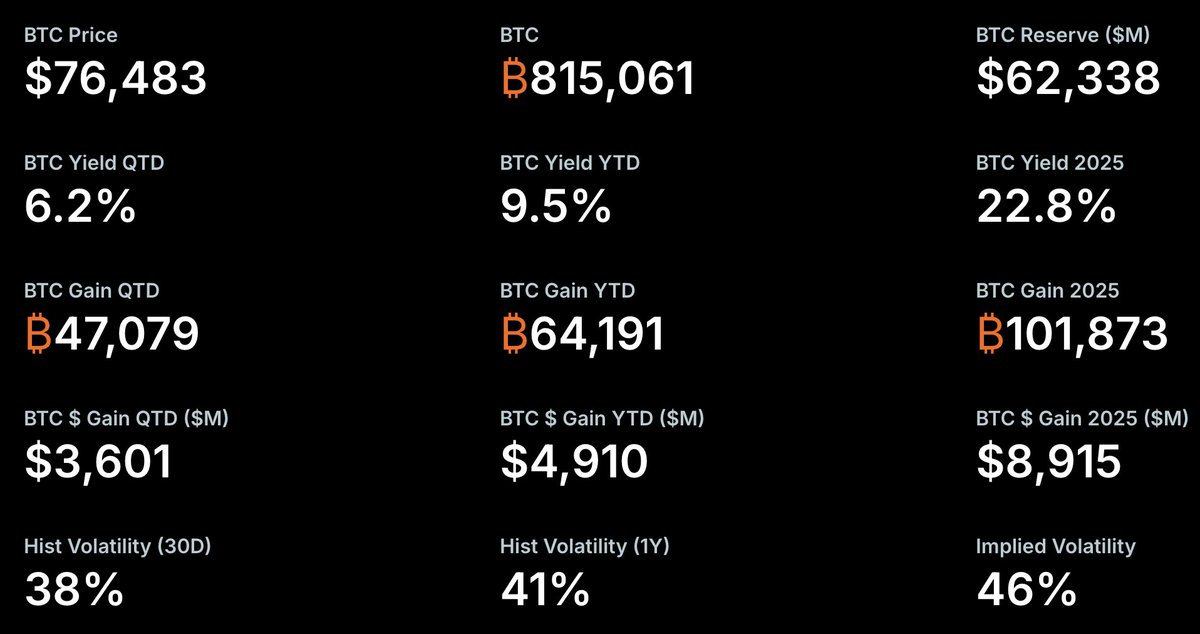
Strategy has generated 6.2% BTC Yield and ₿47,079 of BTC Gain in the first three weeks of April, worth approximately $3.6 billion. BTC Gain is the closest analog to Net Income on the Bitcoin Standard. $MSTR
Strategy has acquired 34,164 BTC for ~$2.54 billion at ~$74,395 per bitcoin and has achieved BTC Yield of 9.5% YTD 2026. As of 4/19/2026, we hodl 815,061 $BTC acquired for ~$61.56 billion at ~$75,527 per bitcoin. $MSTR $STRC https://t.co/ifGXjMeIZH
🔥THIS IS INSANE: STRATEGY'S $42 BILLION BITCOIN SUPER WEAPON🔥
YOU ARE NOT BULLISH ENOUGH ON MSTR.
Strategy just approved $21B of STRC ATM and $21B of MSTR ATM.
Now here’s the part the market is too concussed to understand:
At current balance-sheet settings, every $1 of STRC needs about $1.94 of MSTR to keep amplification flat.
So if STRC is running at $2B/month (current pace over the last month), MSTR has to run at roughly $3.89B/month.
That means Strategy’s real BTC vacuum speed is not $2B/month.
It’s $5.89B/month.
At today’s BTC price, that’s about 83,458 BTC PER MONTH.
Read that again slowly, like a man trying to understand why his “valuation model” just got run over by a cement mixer.
If they scale MSTR issuance enough to support the whole thing, $42B total deployed at flat amplification buys roughly:
595,390 BTC
In about:
7.1 months
Seven months.
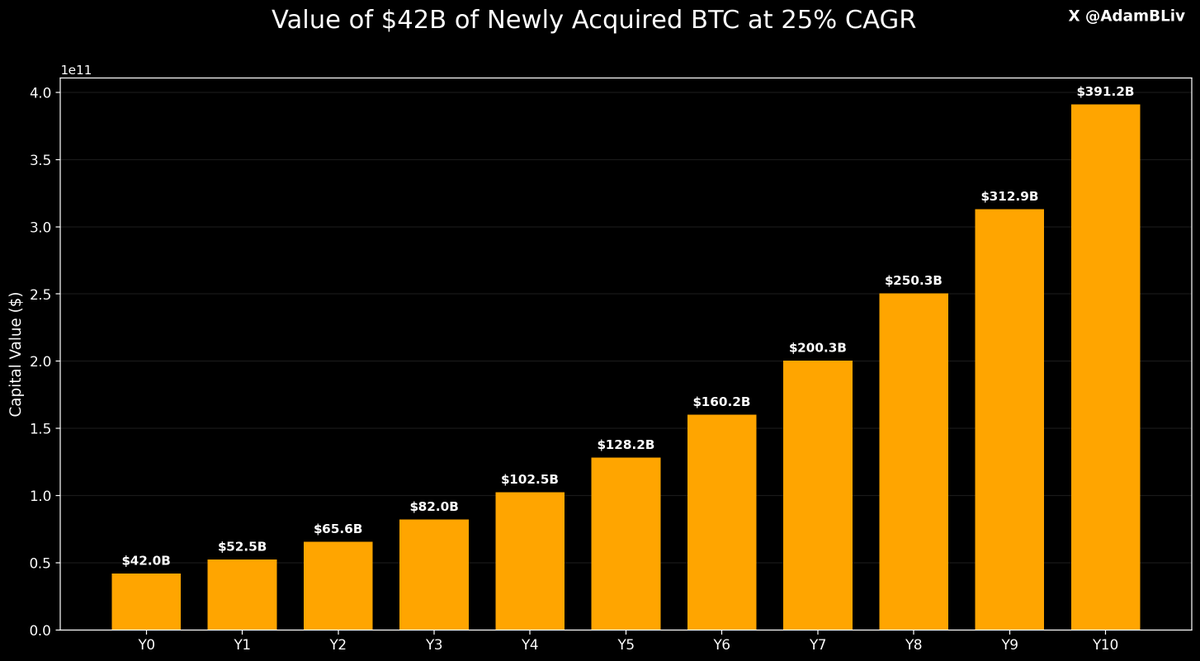
And if Bitcoin compounds at just 25% CAGR from there?
That one acquired BTC tranche grows from:
$42 BILLION to $391 BILLION in 10 YEARS.
That is the kind of math that turns “dilution” into a religious experience.
Even funnier, if they stay strictly inside the newly announced $21B STRC + $21B MSTR envelopes, the MSTR leg is actually the bottleneck.
So the current announced package, held to flat amplification, still supports about:
$31.8B of BTC buying 450,857 BTC in about 5.4 months.
Five months.
That’s the “constrained” case.
The constrained case is still a corporate crackhead trying to buy half the lifeboats on the Titanic while the rest of Wall Street argues about whether the water is technically cold yet.
People still think this is a stock.
No.
This is a Bitcoin acquisition engine with a Nasdaq ticker.
The analysts are still opening Excel.
Saylor is opening the emergency exit on fiat itself.
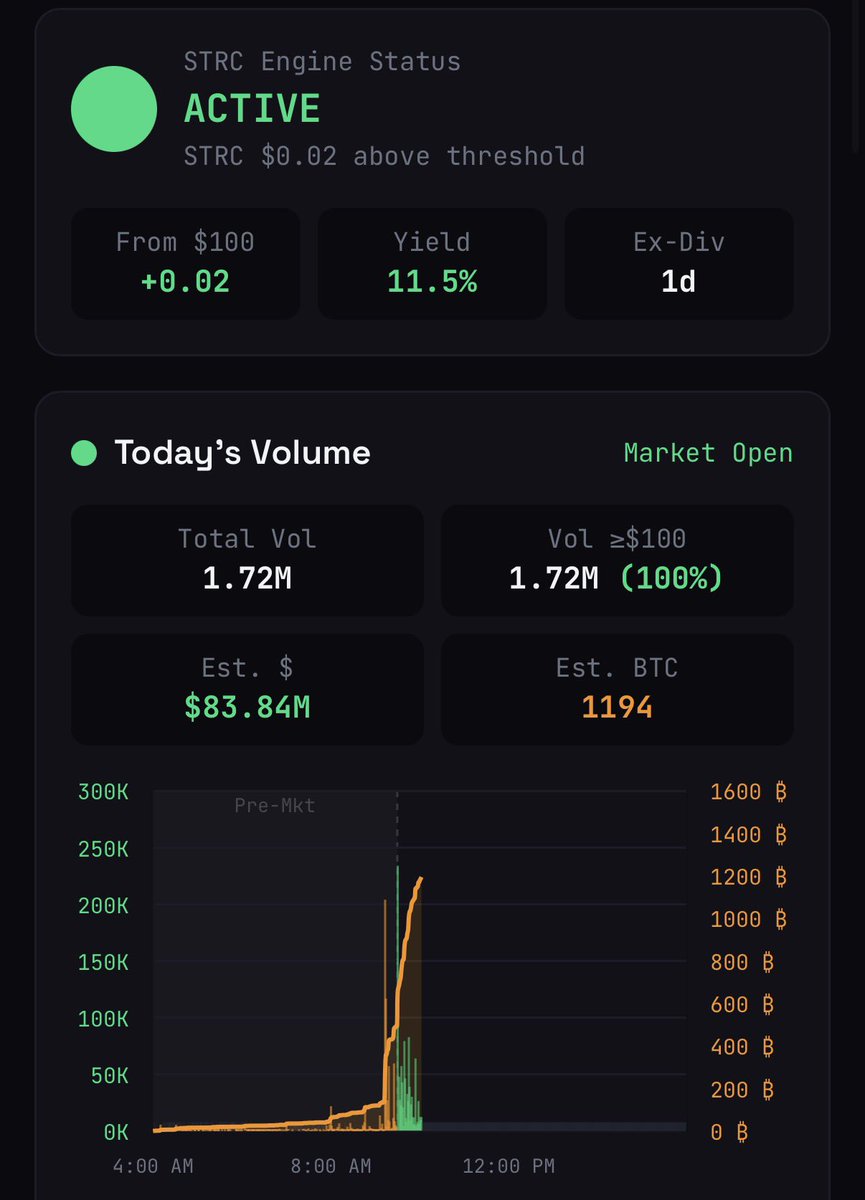
We haven't hit one hour in the market.
We've already bought 2× the daily miner supply through $STRC.
What happens if we do this every day?
This is SINGULARITY.
Get your BTC now or it won't be available to purchase anymore.
MSTR trades like a stock that escaped from the zoo and learned how to print money.
Traditional analysts open the spreadsheet and start sweating immediately.
“Wait… they issue shares… to buy Bitcoin… which makes the shares go up… which lets them issue more shares… to buy more Bitcoin?”
Yes.
Welcome to the recursive nightmare.
Michael Saylor built a financial particle accelerator where capital spins at relativistic speeds until it collides with the hardest asset on Earth.
Every raise buys scarcer money.
The rallies increase the weapon’s range.
The new skeptics become future liquidity.
The S&P 500 watches from the sidelines like a herd of confused cows while one cybernetic bull eats the entire field.
Wall Street still calls it risky.
Bitcoiners call it the most aggressive treasury strategy in human history.