A sub just asked me:
"How do you decide when to buy a bounce off the 21 EMA versus a bounce off the 9 EMA?"
But I don't really think about it that way.
Nobody knows whether a stock is going to bounce off the 9EMA, the 21EMA, or blow right through both. If we knew that, trading would be easy.
What I'm looking for is whether my thesis is being confirmed.
If I think a stock is a leader, pulling back constructively, and setting up for another expansion move, then I'll watch how it behaves around those areas. If price comes into the 9EMA or 21EMA and starts confirming my thesis through relative strength, tightening up, reclaiming pivots, 15/30min breaks, etc., then I'll execute.
1) Sometimes the 9EMA works.
2) Sometimes it needs the 21EMA.
Sometimes I get stopped on the first attempt, and the second or third attempt is the one that sticks.
That's why I focus more on what I can control:
MY PROCESS.
My job isn't to know exactly where the bounce happens...but to recognize when price starts confirming my idea and manage risk if I'm wrong.
Again, my 2 cents.
I lost $60,000+ during my first 2 years in the Market trading 0DTEs & penny stocks.
Please don't be me.
This is exactly what I do now:
- +1 month out minimum on options
- Trade leaders +90% of the time
- Bottom fish maybe ~10%
- Relative strength first, setup second
- Keep losses small
- Weekly chart = thesis
- Daily chart = timing
- 15/30min = execution
- Focus on Stage 1 → Stage 2 transitions
- Compression → expansion
- Price, Volume + 9/21/50EMAs = simplicity
- Price first, volume provides context
- Buy strength off weakness
- Wait for buyers to prove they're there
- Keep losses small
- Average up, never down
- Let winners pay for losers
- Minimize my time on X
- Build conviction through homework
- Trade themes with institutional sponsorship
- no tightness = no trade
- Protect mental capital at all cost
- Break-even means break-even
- Focus on risk before reward
- Journal everything
- Keep losses small
Turns out making money became a lot easier once I simplified my core approach... and stopped trying to turn $500 into a Lamborghini once a week.
My goal is to be one of the top active investors alive. I’m completely delusional. Started from ground zero. Self taught. Thinking I can be the next qullamaggie. Or camillo. Next wizard.
If another man can use the markets to go from flat to $100M, then why not me? Dead serious.
If you are not making money during this run:
You are likely trading the WRONG stocks..
For the last few weeks, all I've done was:
-Focus on strong themes (Semis, space, memory)
-Buy these names on pullbacks into the EMA's
-Hold these winners & don't sell too early
Once these start building bigger bases, now you are going to look for rotation into emerging themes.
How to know where to look?
1. Start With Relative Strength
Emerging themes always leave footprints.
You’ll notice:
-Certain groups stop selling off during weak markets
-They recover faster than indexes
-Multiple stocks in the same niche begin moving together
-Volume starts increasing across the sector
For example:
$IGV was making new highs while $QQQ was still below the previous all time highs
This showed relative strength in the ETF, and software stocks began to emerge with strong setups
2. Scan Weekly Charts First
You will start noticing that when almost every stock in a sector is setup on the weekly timeframe.. and explosive move follows.
Emerging themes usually appear first on:
-Weekly bases
-Weekly breakouts
-Multi-month consolidations
For example data centers recently.. all had a massive weekly base
3. Follow Volume Closely
Volume is one of the clearest signs of institutional participation.
You will start noticing:
-Highest volume EVER print
-Accumulation volume patterns
-Low volume sell offs
-A breakout with expanding volume often signals real demand
This tells you that institutions are piling into the trade
4. Watch for “Character Changes”
One of the earliest clues is a change in behavior.
Examples:
-Stocks stop failing on breakout attempts
-Pullbacks become shallow
-Names begin closing near highs instead of lows
-Weak sectors suddenly start holding moving averages
A new theme usually starts with:
-Better closes
-Better reactions
-Better continuation
before the headlines catch up...
For example $PLTR and $HOOD in the last few days.. starting to act much better and changing their characters.
5. Track News Narratives
Themes are often tied to macro narratives:
-AI spending
-Government backing
-Defense budgets
Follow themes, and stocks that have a REASON to go higher.
For example drone stocks last week, after the news that the government might take a stake...
Now this becomes top watch.
6. Focus on the Leader (Most important)
Every theme usually has:
-a leader
-secondary names
-laggards
The leader is where institutions concentrate first.
Your goal is to find the strongest theme, the strongest sector, and the strongest stock in that sector.
Characteristics of a leader:
-breaks out first
-has the best volume
-holds moving averages best
-reacts strongest after pullbacks
Most importantly... stack probabilities
Theme + Catalyst + Setup + Leading stock = super performance
This is my ultimate starter pack for swing trading:
Indicators:
-8/21/50 Exponential moving averages
-Volume
Setups:
-Tight consolidation spots(Wedge, Flag, Pennant)
-Big bases
-Stage 2
Scanning:
-Top down approach (Start with market trend)
-Find the strongest sectors
-Themes/reasons for sectors to go up
-Scan for leading stock in theme (Volume, RS, Base)
Entry:
-Find big daily key levels (Resistance, Support, moving averages)
-Buy relative strength on weakness
-Buy breakouts on the strongest stocks
-Use the lower timeframe to enter
Exit:
-Stop loss at low of day
-Scaling strategy (Never sell the full position)
-Trim into strength and move stop to even
-Use moving average to trail
My entire system comes down to these 5 things.
One thing newer traders don’t fully appreciate:
In a strong bull market, moving averages can work like magic
When a market is truly strong like it is right now:
-Institutions are consistently buying
-Pullbacks are shallow
-Demand keeps stepping in at predictable areas
That’s where moving averages come in.
They’re not just “lines on a chart”
they represent dynamic areas of demand.
In a weak or choppy market:
-price slices through them
-they lose meaning
But in a strong trend:
-price respects them
-buyers defend them
-they act as launchpads for continuation
You’ll notice:
Clean pullbacks into the 8/21 EMA's
-Immediate reactions off those levels
-Strong continuation after each touch
Everyone is watching the same areas:
retail, funds, algos…
The absolute cheat code is using the moving averages with a pivot to enter
Stock must be:
-Trending
-Breaking out
This is a concept I learned from @1ChartMaster
Wait for a leading stock that is trending to pull back into the key moving averages
After a big breakout you'll want to use the 8 ema...
Once the stock tests the 8 EMA, wait for the first green 30m candle to form after the test
Mark out the highs and lows of the candle
& enter on the break of the candles highs...
Use the first 30m green candle lows as stop
Often times this will get you an entry into some of the best stocks in the market with very low risk.
One of the most common questions I get asked:
"How do you find the right stocks to trade for undercuts?"
Surprisingly the process of my scanning does not change much from trying to find breakout stocks when the markets are hot
The goal is to scan for the BEST stocks in the market...
The ones you want to be positioned in for the next few months... the undercut and rally is simply the entry model to getting in those stocks
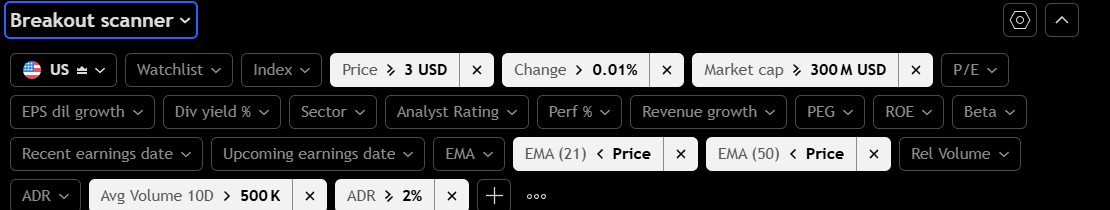
Start on Tradingview:
1. Head to the screener tab
Use these parameters:
Price > 3
Change >0.01
market cap > 300m
Avg vol > 500k
ADR% > 2%
EMA 21 below price
EMA 50 below price
2. Find leading stocks you want to get into
For example:
I'm personally looking for an entry on:
$AAOI, $AMPX, $UAMY
Create a list of these stocks and mark out key levels
3. Sit and wait
The hardest part about this is sitting and waiting for the right entry...
BUT
I promise you it will come--this market has rewarded those that can wait for the right time to strike.
Once the UnR triggers and the stocks reclaim a major low
Enter and put your stop loss at low of day
More often than not you are going to catch a sick entry with very tight risk.
AI-Infrastructure is one of the fastest growing and evolving sectors in the entire tech industry.
Demand is massive and big players are deploying billions of dollars to secure access.
Bottlenecks in this sector are currently a critical focal point that big-tech is trying to fix.
Companies sitting at these bottlenecks will profit massively when capital starts flowing here.
These are the top picks:
Data centers:
Best positioned: $NBIS | Nebius
$CRWV | CoreWeave
$IREN | Iren limited
$ORCL | Oracle
Connectivity
Best positioned: $CRDO | Credo technologies
$AAOI | Applied Optoelectronics
$ALAB | Astera Labs
$LITE | Lumentum Holdings
Energy
Best positioned: $BE | Bloom Energy
$OKLO | Oklo Inc.
$FLNC | Fluence Energy
$EOSE | Eos Energy Enterprises
Supply Bottlenecks
Best positioned: $AXTI | Axt Inc.
$WOLF | Wolfspeed
$IQE | IQE plc
$COHR | Coherent Corp.