20.4 GWh of grid-scale BESS came online in September up 61% YoY.
YTD: 208 GWh (+43%).
Europe alone: +182% YTD.
Solar gets the headlines.
Storage is what makes the grid math work.
$MS $GS $JPM
Q3 trading in one ratio: equities revenue ÷ bond (FICC) revenue.
Morgan Stanley: 2.9x
Goldman: 1.9x
JPMorgan: 0.93x
Bond trading was down YoY at all three. Equities did the lifting.
JPMorgan is the only one where fixed income still out-earns the stock desk.
Open question for Q4: is the equities demand sticky client financing, or just volatility?
$GS made $6.44B trading stocks last quarter. Bonds, currencies & commodities: $3.47B.
A year ago the two desks were basically even ($3.74B vs $3.49B).
The biggest driver wasn’t classic trading. Equities financing — Goldman lending to hedge funds and other clients against their stock positions — nearly doubled to $3.37B. That one line ≈ all of FICC.
$JPM showed the same split: equities +49%, fixed income −4%.
My read: clients are running more leverage in stocks, and the banks are getting paid to fund it. Curious whether $MS confirms it this morning.
Every AI answer is a physical trip:
fiber → switches → GPUs → back to you, one token at a time.
A single NVL72-class rack draws ~120 kW. Most racks were built for 10–30 kW.
That gap is why the AI bottleneck is moving from chips to megawatts.
Check video below for an easier explanation:
#datacenter #stocks #AI #superintelligence
Chicago: Amos Kipruto won in 2:01:09; Kiplimo finished 4th in 2:04:18; Feysa won the women's race in 2:13:33 (unofficial times). Kipruto improved his PB and was just 34 seconds off the course record. This does not support the thesis in #25 that the heat cost ~65 seconds
los yields del Treasury tocaron máximos de 24 años a principios de mes, por miedo a que la energía cara vuelva más pegajosa la inflación.
El S&P 500 y el Nasdaq están planos, con presión sobre tech por el petróleo, antes de los resultados bancarios y los datos de inflación.
El Brent está cerca de $106 y el WTI en $93. El CPI sale el miércoles a las 09:30 ART.
$JPM reports tomorrow before the open.
The last time it raised its 2026 NII guide (Jul 14, to ~$105.5B), the 10-year was at 4.58%. It closed at 5.22% on Oct 8.
Higher long yields help what the bank reinvests its securities book at. They also hurt the mark on that same book.
The number I’ll watch: does ~$105.5B move, and how much of any change is rates vs deposits?
A solar water heater with no pump, no controller and no electricity.
Water at 60 °C is ~1.5% less dense than at 20 °C. That small gap drives the whole loop.
What usually goes wrong:
– tank mounted level with or below the collector → the loop stalls
– hard water → scale builds up in the tubes
– frost → direct systems can crack without freeze protection
Simple physics. Unforgiving installation.
Argentina’s stock market is worth $80B, about 12% of GDP.
The rest of LatAm averages 40%.
Scenario: GDP reaches $1T and the market gets to 30–40% of GDP.
That’s $300–360B, roughly 4x today.
Chicago’s course record is 65s off the world record. Historically, a +5°C WBGT morning costs elite men about the same. Sunday opens at yellow.
#marathon#fitness#sports
Chicago’s course record (2:00:35) is 65 seconds off the world record (1:59:30).
A warm morning can cost about the same.
Ely et al. (2007): top men slowed ~0.9% per +5°C of WBGT above cool conditions. On a 2:00:35 that’s ~65 seconds.
Sunday: ~60°F overnight, race alert opens at yellow. Kiplimo’s PB is only 7s under the record.
My read: if it goes, it goes on cloud cover and pacing, not fitness.
Kiplimo lines up in Chicago on Sunday already 7 seconds faster than the course record. He ran 2:00:28 in London; Kiptum’s Chicago record is 2:00:35.
The gaps in pace terms:
2:00:35 course record = 2:51.5/km
2:00:00 = 2:50.6/km
1:59:30 world record = 2:49.9/km
Under one second per km separates “course record” from “sub-2.” Last year he was on world-record pace until ~35K and finished in 2:02:23. The last 7K is the whole race.
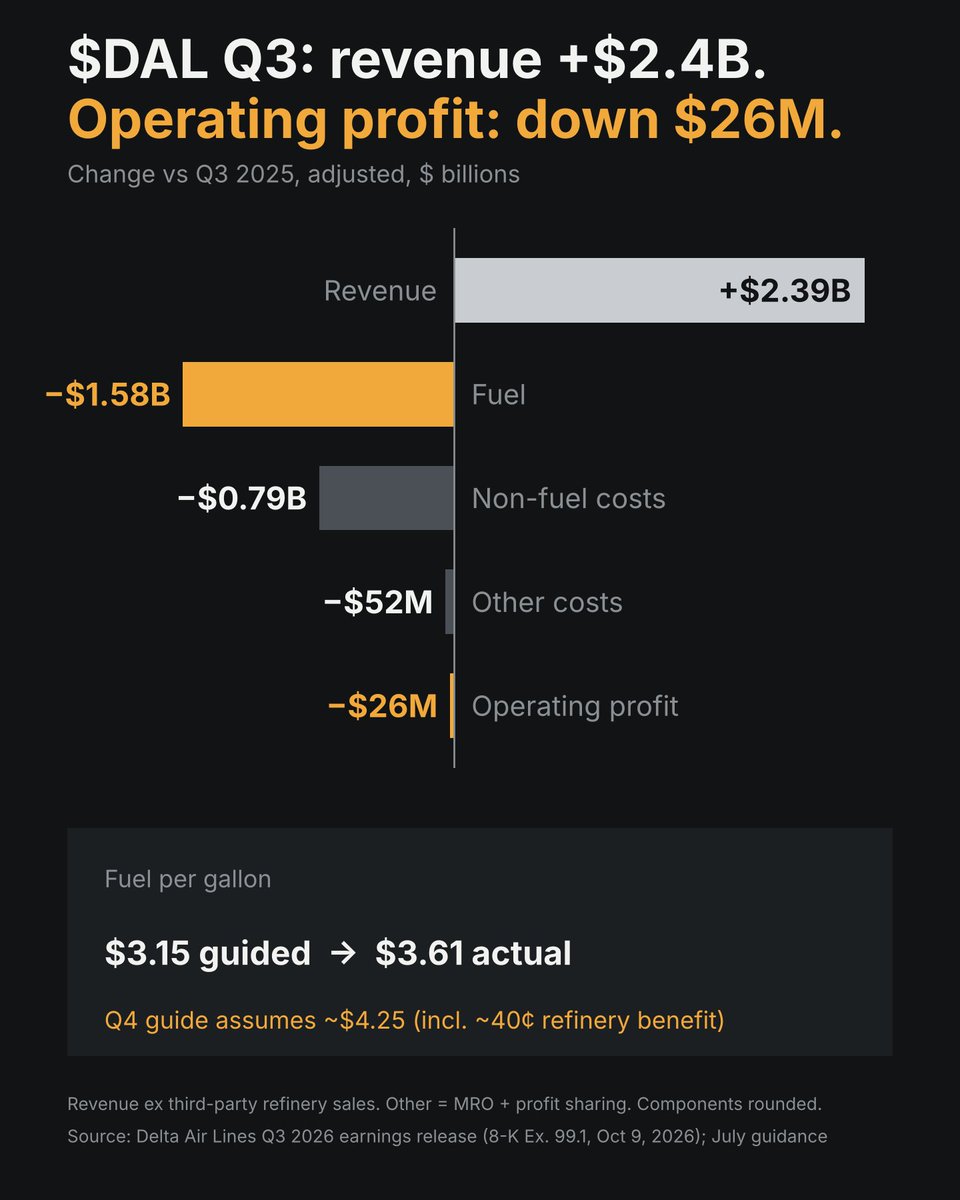
$DAL grew Q3 revenue 16% on flat capacity. Operating profit still fell.
Revenue +$2.39B. Fuel +$1.58B. Everything else +$0.84B.
Fuel came in at $3.61/gal vs the $3.15 it guided in July.
The harder number is Q4: the guide assumes ~$4.25/gal, and that already includes ~40¢ of help from Delta’s own refinery. Full-year EPS guide: $6.50–7.50 → $5.10–5.60.
Fares are clearly moving. The question for $UAL on Oct 20 is whether they can keep chasing fuel above $4.
$SATL did the thing you want to see at support today.
Space sold off again (RKLB and ASTS down harder). SATL lost $5, flushed to ~$4.90, then reclaimed $5 and VWAP late in the session, with volume picking up on the bounce, not on the dump.
$5 is the Sept breakout level (Sep 18: 14M shares, low exactly $5.00). An undercut and reclaim says more than a clean hold.
Next: $5.14–5.18 (yesterday’s close). Back below ~$4.90 = the reclaim failed.
I hold $SATL. Not advice.
$SATL lost $5 today.
Flushed to $4.90, and took it back into the close, with volume on the bounce, not the dump.
$5 is the Sept breakout level.
Below $4.90 the reclaim failed
above $5.18 it's working.
$DAL reports tomorrow. The number I'm watching isn't EPS. It's fuel.
Q3 guidance ($2.00–2.50 EPS, 11–13% margin) assumed ~$3.15/gal all-in.
Gulf Coast jet spot averaged $3.40 in July and $3.72 in August (EIA). In Q2, Delta's all-in price ran ~$0.29 above the spot average.
At Q2 volumes, every 10¢/gal ≈ $110M a quarter.
The question: how much of that did fares already cover?