Indian markets have two faces right now.
The Nifty heavyweights are struggling, but beneath the surface, mid-caps and small-caps continue to quietly outperform !!
https://t.co/lUYQ3aPvvu
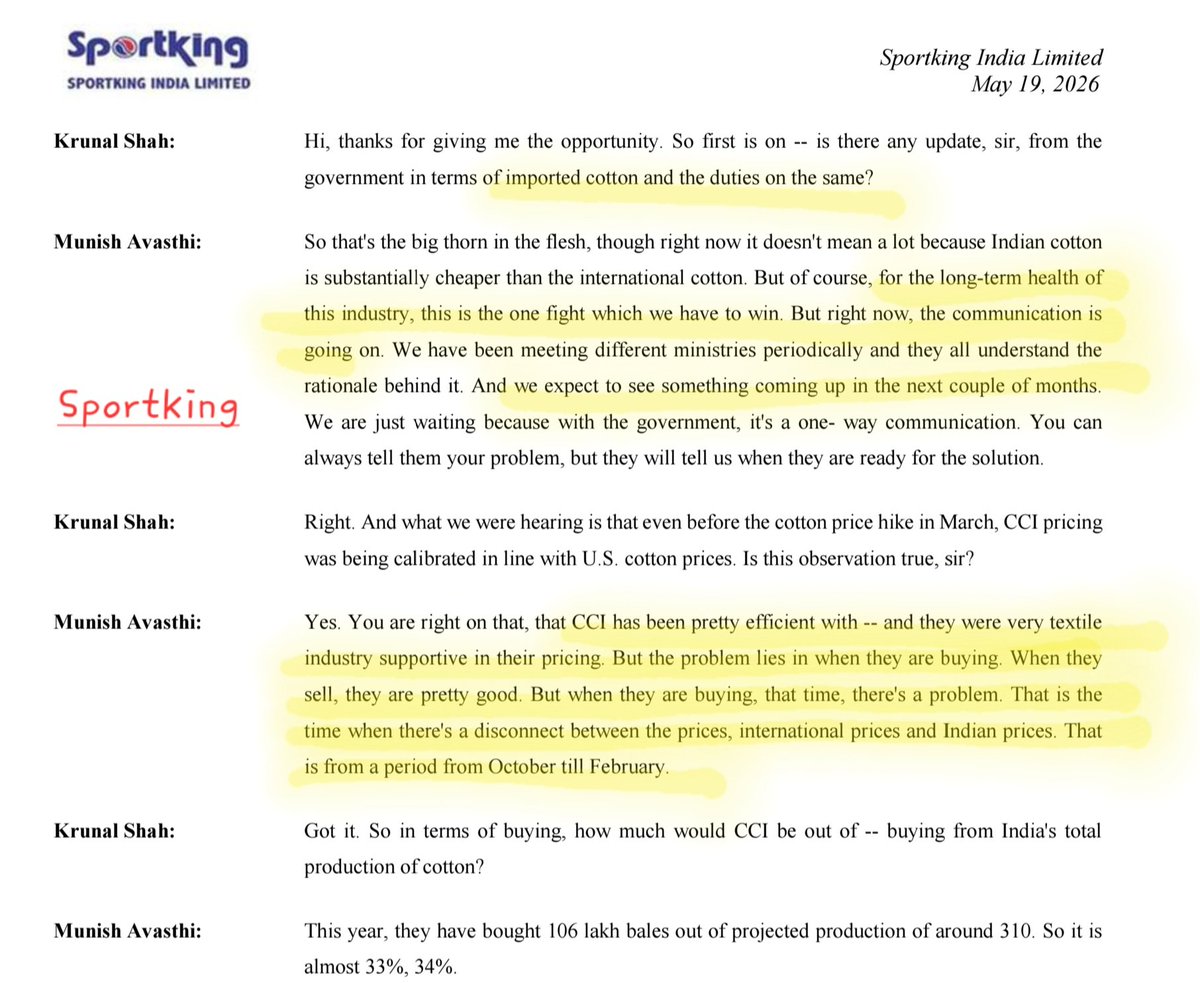
India removed cotton import duty for 5 months.
Notable thing is that it was a recurring ask across textile earnings calls:
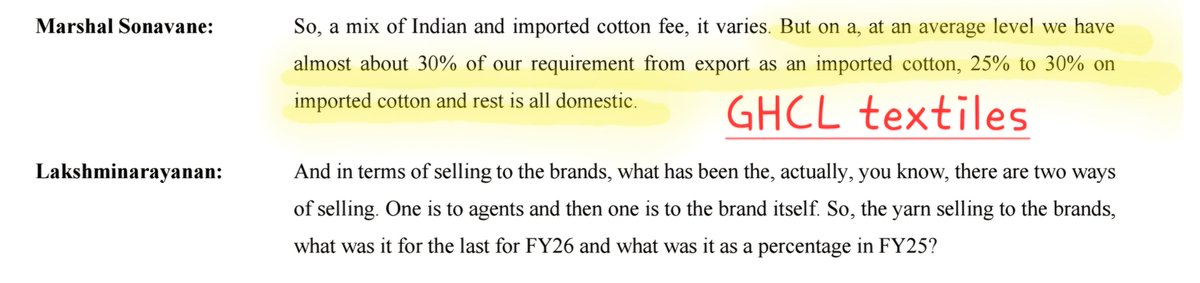
→ GHCL Textiles: ~30% of cotton requirement imported
→ Nitin Spinners: Industry sought permanent duty removal
→ Sportking: Called it "the one fight we have to win"
→ Vardhman: Warned of cotton shortage and pushed for duty-free imports
Government has finally provided some temporary relief to the industry
Potential beneficiaries: Spinners, yarn exporters and integrated textile players
#textiles #cotton
Why is the world suddenly watching the U.S. 10-Year Yield at 4.6%?
Every time yields moved near 4.5%–4.6%, something BIG followed
This gave birth to the famous “TACO Trade” 🌮
Find out all !!
All headline indices trading below 50/200 dema (Nifty, Bank Nifty, Nifty 500) but Nifty Smallcap100, Nifty Microcap 250 trading above 50/200 dema !!
Will this outperformance continue ?
Technical Analysis for Investors
📍 Hotel Tunga International, Andheri (E), Mumbai
🗓️ 13 June 2026 | 9 AM – 6 PM
💰 Price: ₹2,500/-
For more details:
📞 +91 7977801488
Follow the link to purchase:
https://t.co/ahL1rYyhld
Clone investing – an interesting strategy to follow smart money without reinventing the wheel
Track what seasoned investors are buying and ride along selectively — not blindly
Most people track price. Smart investors track delivery volumes too.
Use @mystockedge for delivery trends and @NSEIndia & @BSEIndia website for downloading historical data and live delivery data
Price shows movement. Delivery volume shows conviction !!
#deliveryvolumes
@d@doshi_harsh
Where to analyse quarterly results !!
Handles covered
1) @screener_in
2) @stockscansin
3)https://t.co/DC4MHSsMeK
4) @nid_rockz
Follow us for more such recommendations !!
Kicking off a new “How To” series for investors and traders in Indian equity markets.
First up: How and where to analyse bulk deals !!
All the links
Nse
https://t.co/6mXRm2foks
Bse
https://t.co/3uRNOiY4w6
Stockedge
https://t.co/HjChheNrz4
Trendlyne
https://t.co/9QFJZOzZNA
Manish Mall
https://t.co/AmcIi1rXHw
Mayank Patwardhan
https://t.co/3Gk6bfc4eZ
#bulkdeals
India's greatest investment advantage isn't its demographics, its digital stack, or its $3,000 per capita inflection.
It's the fact that every time India has been pushed to the wall — famine, bankruptcy, sanctions, market panic — it has come back structurally stronger. Every. Single. Time.
We studied 10 defining crises across 78 years. The pattern is unmistakable: pressure in, capability out. Gold pledged in 1991 → economy liberalised. "Fragile Five" in 2013 → $640B forex fortress today. 2 mobile units in 2014 → world's #2 manufacturer by 2025.
Our latest deep dive: "The Pressure-Forged Economy" — why India's resilience is not a feature to admire, but the feature to allocate to.
Nifty50 - Triple Positive RSI Divergence. Major Bottoms.
In simple terms, a RSI Positive Divergence is New lows on Nifty but higher bottoms on Daily RSI.
This setup has worked brilliantly to spot Risk-Reward Entry Points near Bottoms in the last 10 years.
Examples below
Insiders buying from open market - interesting stocks where promoters are actively buying from the open market.
Do your own research, Not a Reco.
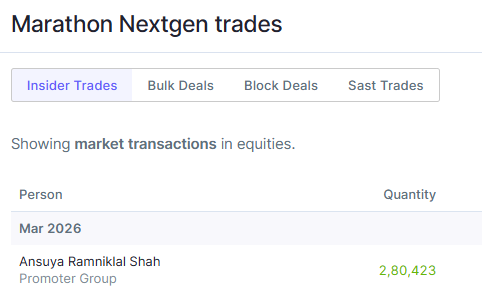
Marathon Nextgen Realty - CMP 392
Promoters bought
> ~2.8 lakh shares in Mar’26
> worth ~₹11–11.5 Cr
> at ~₹411/share
> ~0.42% equity increase
Operates in Mumbai Metropolitan Region (MMR); exposure to infra developments like Navi Mumbai Airport, Atal Setu, and Metro expansion
Business spans residential and commercial segments
> Residential: luxury (Monte South), mid/affordable (NeoHomes, Nexzone)
> Commercial: Futurex, Millennium
> Mix: ~26% luxury, ~24% mid-income, ~30% commercial
Proposed merger of 7 promoter group entities into the listed company
> Adds ~400 acres land
> ~4.2 crore sq ft developable area
> Key locations: Panvel, Bhandup, Dombivli
> Promoter gets shares of MNRL at: ~₹575/share
> Net debt reduced from ~₹838 Cr to net cash position
> ₹900 Cr QIP (June 2025)
> 1.62 Cr shares issued at ₹555.13
> ~₹340 Cr used for debt reduction
QIP participants:
DIIs:
> Quant Mutual Fund (~39.4%),
> Samco Mutual Fund,
> Kotak Alternate Asset Managers,
> SageOne Investment Managers,
> Buoyant Capital,
> Brescon Opportunities Fund
FIIs:
> Maybank Securities (~14.4%),
> Zeta Global Funds (~9.5%),
> Morgan Stanley Asia,
> Citigroup Global Markets,
> Nomura Singapore,
> North Star Opportunities Fund,
> Eminence Global Fund PCC,
> Necta Bloom VCC
Disclosure: https://t.co/3RJi9jNHCJ
Other Interesting Stocks
> Maharashtra Seamless - https://t.co/cBp0CdsAh8
Insiders buying from open market - Will be listing interesting stocks where promoters are actively buying from the open market.
Do your own research, Not a Reco.
Maharashtra Seamless - CMP 577
• Promoters ↑ stake to 69.81% (from 59.8% in 2017)
• Recent buy: 6.3L shares / ₹34.6cr @ ₹549 (Q4 FY26)
• Stock didn’t make new lows in Jan–Mar’26 correction
• Business: supplies pipes for oil & gas drilling
• ~33% order book from ONGC/Oil India
• Market share: 55% seamless | 18% ERW
• Only Indian player with full range up to 20 inches
• Industry structure: limited domestic competition (exits/bankruptcies over time)
• Imports still ~20–25% of market (incl. China)
• Anti-dumping duty (since 2021) + DMI/SP policy support domestic players
• PSU tenders ≤₹200cr restricted to domestic bidders
• USTPL acquisition:
– ₹550cr total investment
– ₹100–200cr EBITDA annually
– ~₹375cr tax benefit from accumulated losses
• Balance sheet:
– Debt: ₹1,145cr (FY20) → 0
– Net cash: ₹3,404cr (~half mcap of ~₹7,215cr)
– Investments: ₹1,007cr (FY20) → ₹3,385cr (Sep’25)
– Liquid investments: ₹3,414cr
• Earnings trend:
– Profit: ₹121cr (FY21) → ₹952cr (FY24) → ₹777cr (FY25)
– EBITDA/ton: ₹20,020 → ₹12,074 (Q3 FY25 → Q3 FY26)
– Revenue growth relatively flat; other income contributing
• Industry demand:
– Linked to ONGC/Oil India drilling activity
– India oil production ↓ 2.5%, gas ↓ 1% (FY25)
• Valuation: ~9x PE | 1.1x PB (BV ~₹490/share, ~half in cash)
• Return ratios: ROCE 16.6% | ROE 12.9% (vs ~23% ROCE in FY24)
Disclosure: https://t.co/m7SmFKI9bL
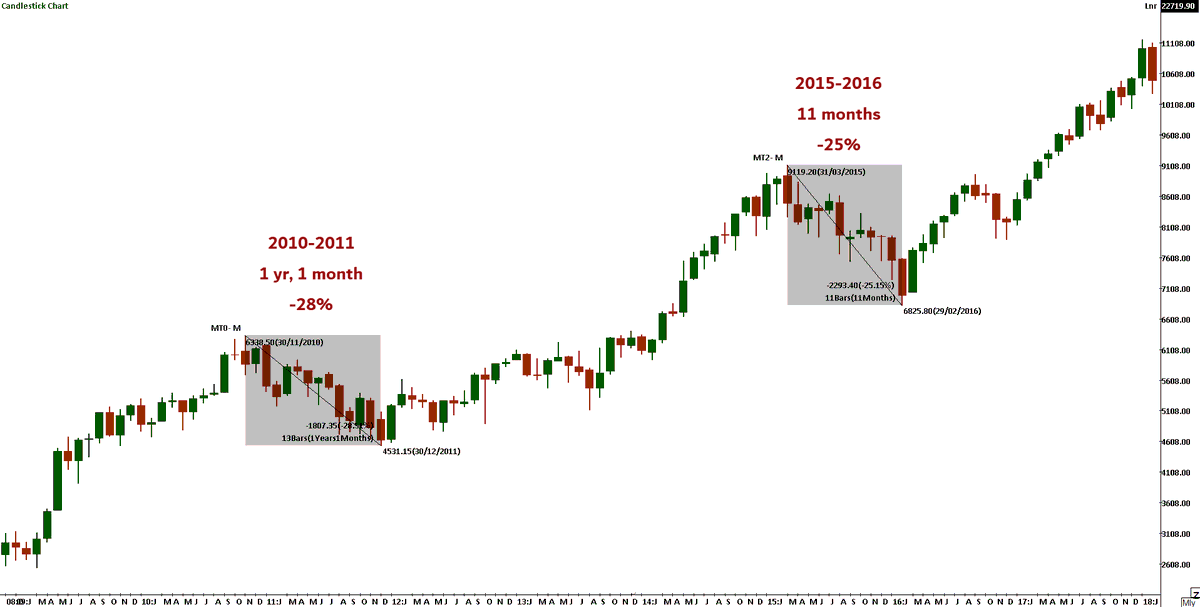
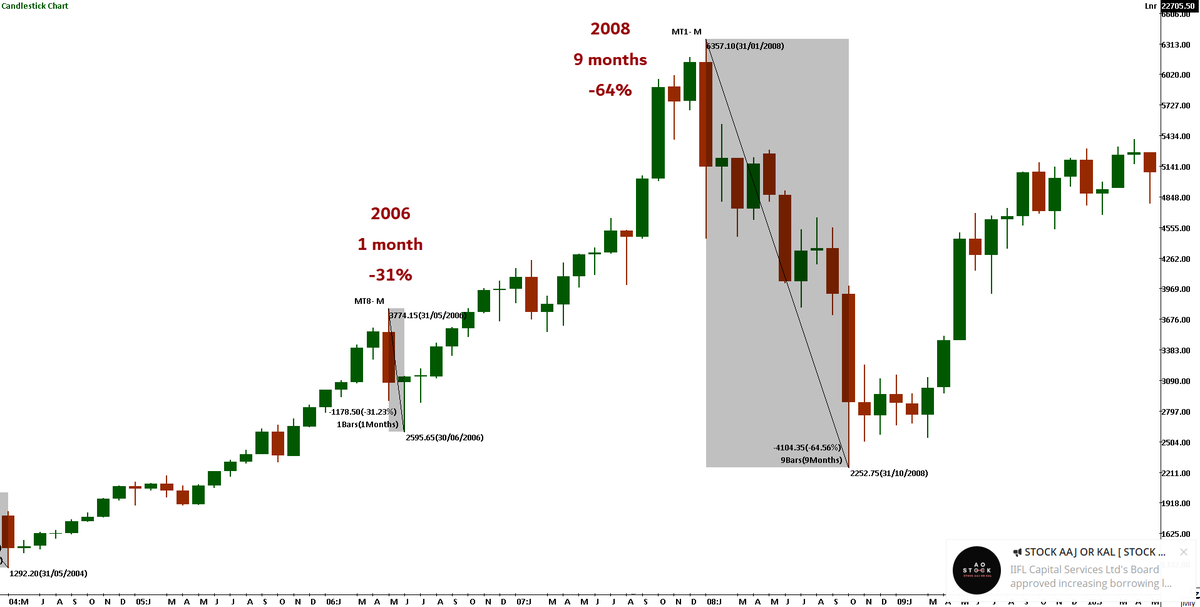
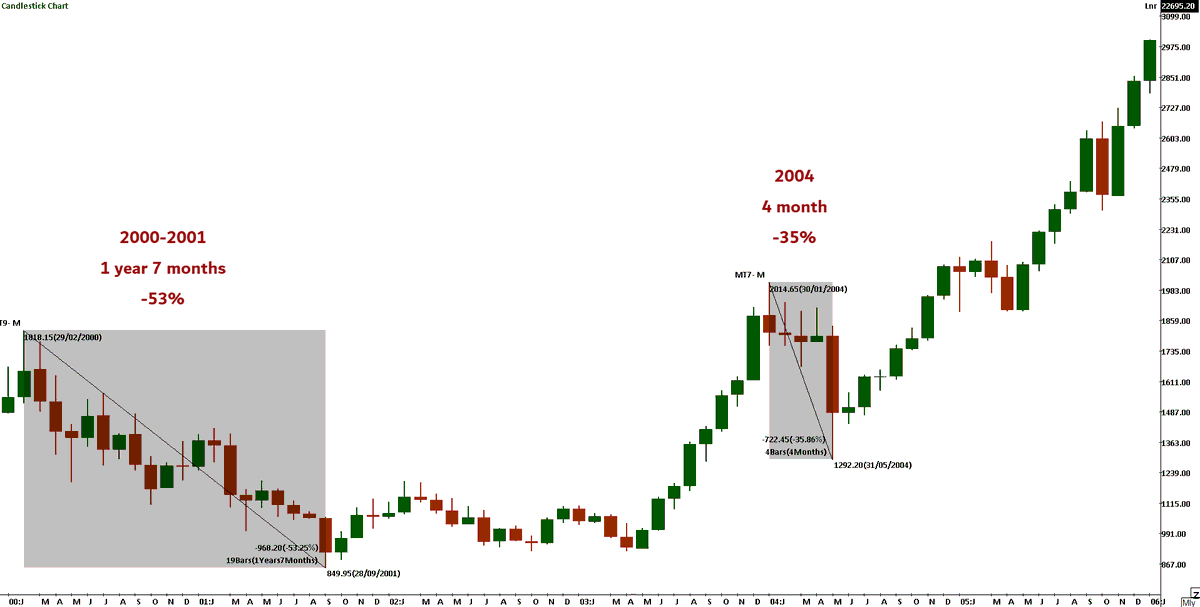
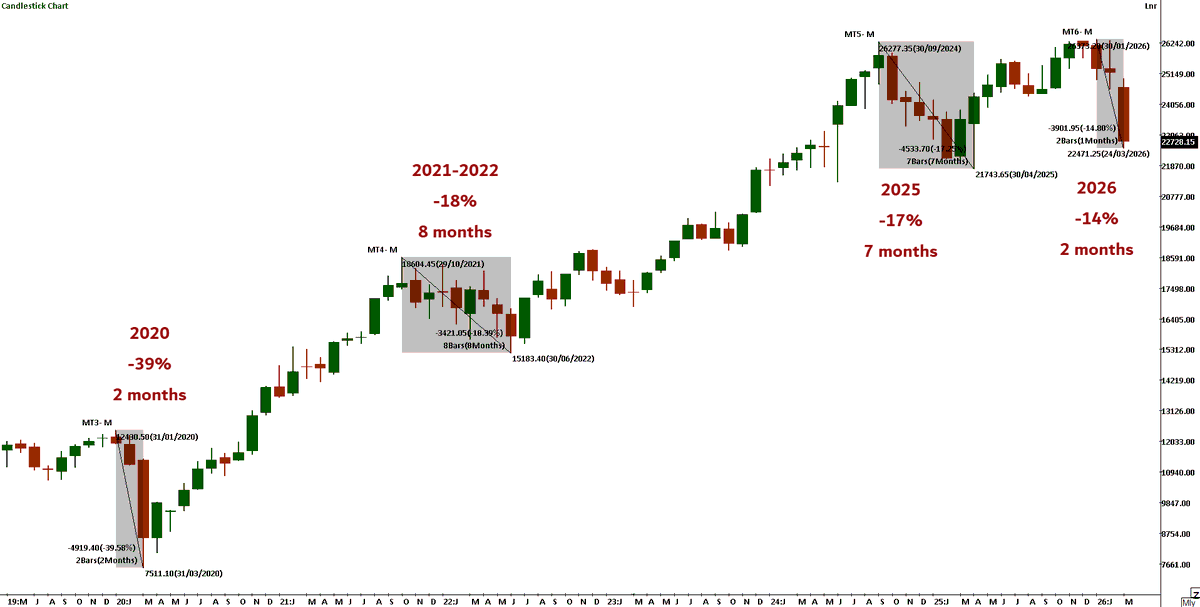
Nifty - Historical Corrections - Monthly Charts
1) 2000 to 2001 -53% in 1yr 7m
2) 2004 -35% in 4m
3) 2006 -31% in 1m
4) 2008 -64% in 9m
5) 2010 to 2011 -28% in 1yr 1m
6) 2015 to 2016 -25% in 11m
7) 2020 -39% in 2m
8) 2021 to 2022 -18% in 8m
9) 2025 -17% in 7m
10) 2026 -14% in 2m