@LordGrimdark@torbooks@Litescalates "Looking forward to your new release, Joe! Have you ever considered adding scenes where characters suffer through bugs that chew you up while you sleep? I have recently experienced it in Cambodia, and it seems like it would fit your style of gritty realism perfectly. 😄"
What's the #Product lesson you learned lately that you think others should know about? Come on the #POSummit, and share your story, and help our community grow! Submit your session here: https://t.co/Idw8KWwO6b
🌟 Want to be recognized as a Product Ownership expert? Submit your talk for the Product Owner Summit 2024 and showcase your expertise to a global audience! Submit here: https://t.co/nOX9GU08cq #POSummit#ProductOwnership
https://t.co/A46d9v0fX3
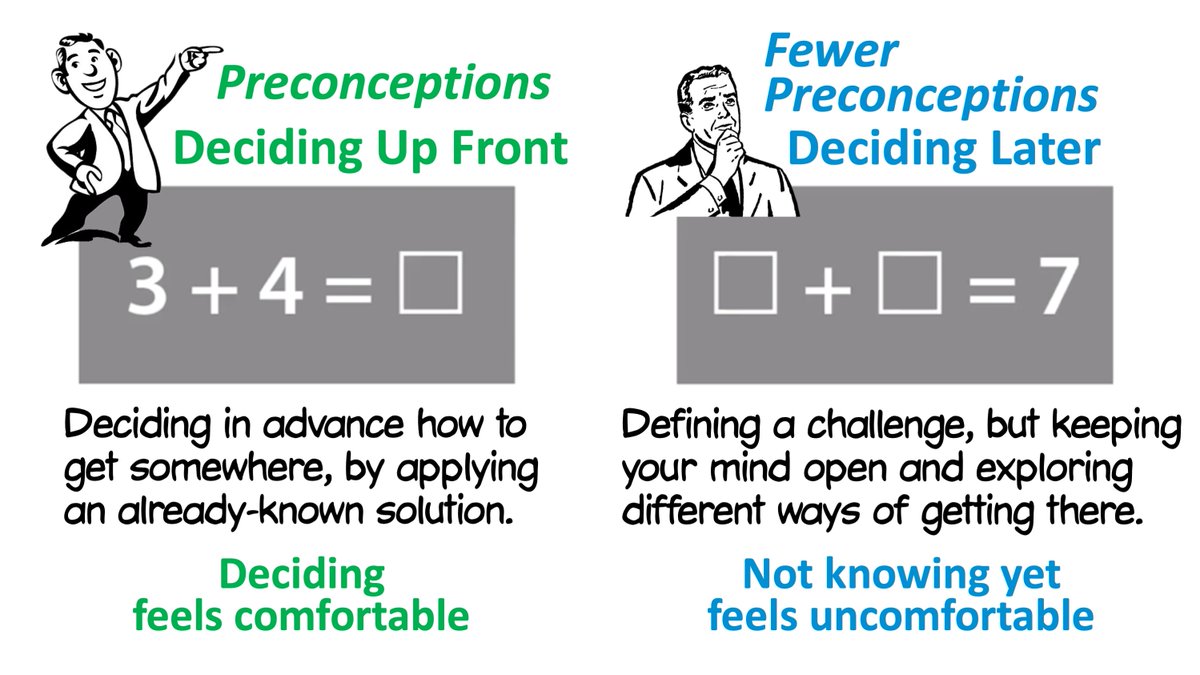
Not deciding on one option right away may look indecisive and slow, but is often faster and better in the long run. Read about it here:
👉https://t.co/zTKGeV6BH1
(Hat tip to Bob Emiliani for the graphic idea.)
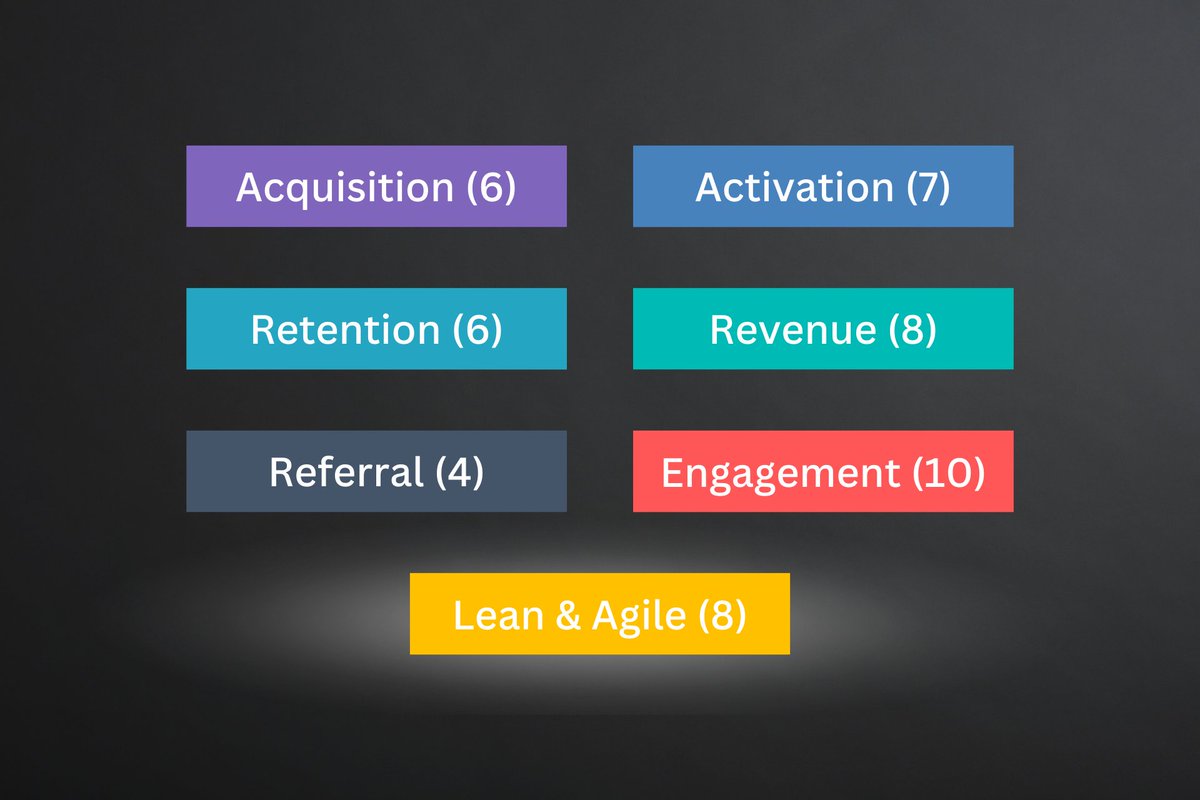
The Ultimate List of Product Metrics: Extended Edition
1. Acquisition Metrics
2. Activation Metrics
3. Engagement Metrics
4. Retention Metrics
5. Revenue Metrics
6. Referral Metrics
7. Lean and Agile Metrics
8. Conclusions and resources
The classification below is based primarily on the AARRR (Acquisition, Activation, Retention, Revenue, Referral) framework, which is universal, and fits every organization that works on customer-facing tech products.
On top of that, I added two categories:
Engagement Metrics: I want to emphasize the distinct metrics focusing on user interaction with the product. More in the 3rd point.
Lean and Agile Metrics: Metrics related to the effectiveness of delivering value. Some of them, like Time to Market (TTM) or Time to Learn (TTL), are essential to succeed by quickly adapting to the changing market conditions.
Without further ado:
1. Acquisition Metrics
1.1 Bounce Rate
The percentage of visitors who leave your website after viewing just one page. A high bounce rate may indicate issues with the landing page (e.g., messaging) or targeting.
1.2 Conversion Rate
The percentage of users who take a desired action, like signing up for a newsletter.
1.3 Landing Page Conversion Rate
The percentage of visitors who take a desired action on a specific landing page, like signing up or starting a trial, on a specific landing page.
1.4 Cost of Customer Acquisition (CAC)
The cost of acquiring a new customer through marketing and sales efforts.
1.5 Channel Effectiveness
The success of each acquisition channel in driving traffic, sign-ups, or purchases.
1.6 Traffic Source Distribution
The breakdown of incoming user traffic by different sources, such as organic search, referrals, or paid ads.
2. Activation Metrics
2.1 Time to Value (TTV)
The time it takes for a user to experience the core benefits of your product after starting to use it. A shorter TTV leads to higher user satisfaction, engagement, and retention. In product-led growth, optimizing TTV is crucial to ensure users quickly understand the value your product delivers.
2.2 Onboarding Completion Rate
The percentage of users who complete the onboarding process successfully.
2.3 User Activation Rate
The percentage of users who successfully complete a certain milestone in your onboarding process.
2.4 Trial-to-Paid Conversion Rate
The percentage of trial users who convert into paying customers.
2.5 First-time User Conversion Rate
The percentage of first-time users who complete a desired action, such as creating an account or purchasing. This metric helps assess the effectiveness of the onboarding process.
2.6 Product Qualified Accounts (PQA)
“In product-led sales, the product determines Product Qualified Accounts (PQA) to indicate when an account is prepared for sales engagement and potential conversion.” - @ElenaVerna, link in my full article
2.7 Product Qualified Leads (PQL)
“PQLs, or Product Qualified Leads, are the people within the existing self-serve user base with buying power.” - @ElenaVerna, link in my full article
3. Engagement Metrics
Engagement Metrics can be considered part of the Retention and, depending on the context, Activation (e.g., Session Length). I presented them as a separate category to emphasize the distinct metrics focusing on user interaction with the product.
3.1 Daily Active Users (DAU)
The number of unique users who engage with the product daily.
3.2 Monthly Active Users (MAU)
The number of unique users who engage with the product monthly.
3.3 Stickiness
The ratio of daily active users (DAU) to monthly active users (MAU), which indicates how often users engage with the product.
Stickiness = DAU / MAU
3.4 User Satisfaction (CSAT)
A measure of how satisfied users are with the product, often determined through surveys or in-app feedback (e.g., Pendo, Gainsight).
3.5 Session Length
The duration of a user's interaction with the product during a single session.
3.6 Session Frequency
The average number of sessions per user within a specific time frame.
3.7 Feature Usage
The frequency and depth of usage for specific product features.
3.8 Customer Effort Score (CES)
Measures the ease with which customers can interact with your product or service. It is often determined by asking users to rate the effort required to accomplish a task or resolve an issue on a scale from very low to very high effort.
A lower CES indicates a more user-friendly product, which can lead to higher user satisfaction and loyalty.
3.9 Task Success Rate
The percentage of users who successfully complete a specific task or set of tasks within your product. This metric helps assess the usability and effectiveness of your product's features.
3.10 User Feedback Score
A quantitative measure of user satisfaction gathered through surveys, ratings, or reviews.
There isn't a single standardized method or rating scale. This could be a numeric scale (e.g., 1 to 5 or 1 to 10), a star rating, or a qualitative scale (e.g., poor, average, excellent).
4. Retention Metrics
4.1 Churn Rate
The percentage of users who stop using the product within a specific period, e.g., monthly.
4.2 User Retention Rate
The percentage of users who continue using the product after a specific period. Often monthly.
4.3 User Renewal Rate
The percentage of users who renew their subscription or continue using the product after their initial contract period.
4.4 Customer Lifetime
The average time it takes for a user to stop using the product.
Customer Lifetime = 1 / Churn Rate
4.5 Customer Health Score
A composite metric that combines multiple indicators, such as usage, satisfaction, and support interactions, to provide an overall assessment of the customer's relationship with the product.
4.6 Product Adoption Rate
The percentage of users who adopt new features or functionality within a certain time frame after release.
5. Revenue Metrics
5.1 Average Revenue Per Account (ARPA)
The average revenue generated per account (customer) within a specific time frame. For example, monthly.
5.2 Customer Lifetime Value (CLV/LTV)
The total revenue a user generates during their entire relationship with the product.
CLV = Customer Lifetime * ARPA
5.3 Customer Profitability
The difference between the lifetime value of a customer (LTV) and the cost of acquiring them (CAC).
5.4 Monthly Recurring Revenue (MRR)
The predictable revenue generated by a subscription-based product every month.
5.5 Expansion Revenue
Additional revenue generated from existing customers through upsells, cross-sells, or add-on purchases.
5.6 Net Revenue Churn
The revenue lost due to customer cancellations, downgrades, or non-renewals within a specific period, typically a month/year.
5.7 Net Revenue Retention
The cumulative sum of retained, contracted, and expanded revenue over a specific period, typically a month or year.
5.8 Average Contract Value (ACV)
The average revenue generated from each customer contract, which can help assess the effectiveness of pricing and packaging strategies.
6. Referral Metrics
6.1 Virality Coefficient
The number of new users acquired through referrals by existing users. Often expressed as a ratio (<1, 1, >1).
6.2 Customer Referral Rate
The percentage of customers who refer others to the product.
6.3 Referral Conversion Rate
The percentage of referrals that convert into active users.
6.4 Net Promoter Score (NPS)
A measure of customer satisfaction and loyalty based on how likely users are to recommend the product to others.
NPS = % of Promoters - % of Detractors
(-100 to 100)
Warning: NPS measures customer attitude and sentiment, not the actual behavior.
7. Agile and Lean Metrics
Before we dive in, it's important to remember that Kanban aims to optimize the flow of value, not the flow of work
So, for example, if you use User Stories and sub-tasks, focus on tracking the whole User Stories, not individual sub-tasks.
7.1 Lead Time
A Kanban metric that measures the total time between an idea placed in a Product Backlog until the work in a specific process is completed.
For example, if Microsoft decides to use ChatGTP in Bing, Lead Time would be the time between deciding on a specific approach and when the feature is production-ready.
7.2 Time to Market (TTM)
Time to Market (TTM) is a broader concept, encompassing idea generation, experimentation, product delivery, and pre-launch activities that might be required before an idea is shipped.
For example, if Microsoft decides to incorporate ChatGPT into Bing, the TTM would be the period between having a draft idea and when customers can use a new capability.
7.3 Cycle Time
A Kanban metric that is a component of Lead Time. It measures the time it takes from when the implementation of an idea begins until it's done.
For example, if Microsoft decides to incorporate ChatGPT into Bing, the Cycle Time would be the period between when developers start implementing a specific idea and when it becomes production-ready.
7.4 Work In Progress (WIP)
WIP is a Kanban metric that represents the number of ideas that your team is currently working on.
The goal is to limit WIP to reduce context-switching and minimize the Cycle Time. This ultimately minimizes the Time To Market (TTM).
7.5 Throughput
The rate at which ideas pass through your team's workflow over a given period.
...
Continue reading for free
Due to character limit, continue reading for free here (no email, no paywall): https://t.co/A9wp0GTGNc
- Visualizations
- Lean and Agile metrics
- Conclusions
- Additional techniques
- Free resources
Hope that helps!
Pretty stoked about this. The CORE podcast is joining forces with Doghouse Systems & Intel to give away a decked-out high end gaming rig to a lucky winner. Hit the link for details & timing, and to sign up for your chance to win! https://t.co/0QCj8hXCgd @corepod@DogHouseSystems
The hell with it … even though Starlink is still losing money & other companies are getting billions of taxpayer $, we’ll just keep funding Ukraine govt for free